


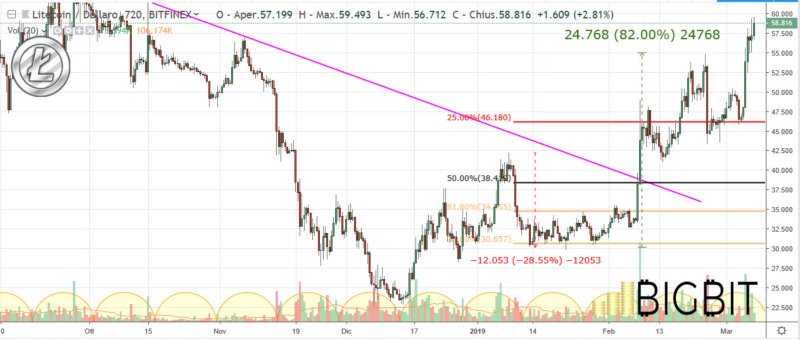
Today, as far as the technical analysis of the price of the major cryptocurrencies is concerned, Litecoin is certainly worth mentioning, with a performance of +4% on a daily basis, returning to regain the 4th position in the ranking at the expense of EOS.
EOS, despite the retreat to 5th position, remains close to the threshold of 4 dollars, which is ready to be attacked again and violated upwards with a more convincing dynamic than that occurred two weeks ago.
At the end of February, the break of the 4 dollars brought the price to 4,50$ for a few hours, but it was followed by a fast retreat which was technically not very encouraging.
On a weekly basis, Litecoin sees a price rise of 25%.
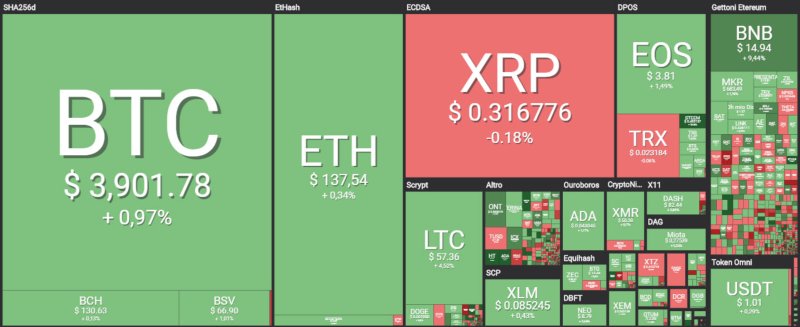
Focusing on the first three cryptocurrencies, the overall situation remains unchanged when taking the last 48 hours as a reference.
Remaining within the scope of price analysis of the main altcoins, the excellent performance of Binance Coin should be highlighted once again, with a daily rise that is close to double-digit.
BNB climbs to 7th position, a step away from ousting the 6th place still held by Bitcoin Cash.
The signals from the point of view of the market cap are comforting with consolidation over 130 billion dollars, 133 billion to be precise. Bitcoin’s dominance in recent weeks hasn’t changed much but is now falling back to 51%, a critical threshold that since last August 2018 has never been affected.
The volumes in the last 24 hours fall below 20% with trades amounting to just over 25 billion dollars.
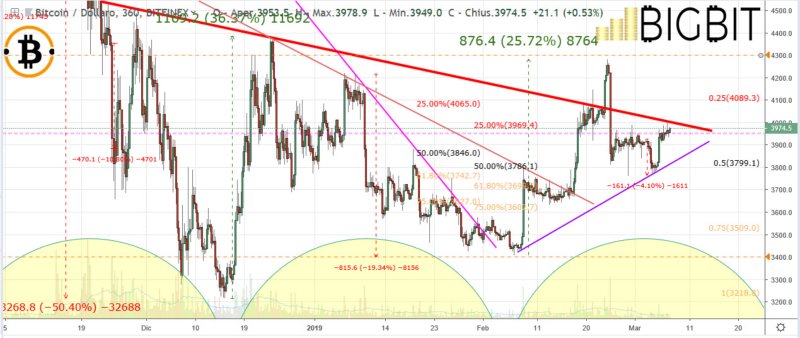
Bitcoin Price Analysis (BTC)
Bitcoin, despite its laziness, silently returns to approach $4,000, a very important technical area.
A possible break would attract the levels to the next resistance of $4,200, a critical threshold due to the fact that an upward violation would accompany a possible move up to $4,400.
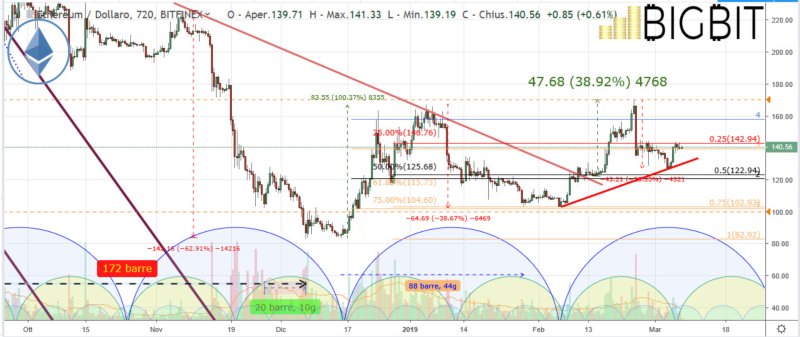
Ethereum price analysis
The one-week fluctuations remain attracted by the threshold of $140, a watershed area that is not currently giving operational signals.
A calm sea for the variations of the Ethereum price, imperceptible on a daily basis.
Caution: a violation of the dynamic support of the 130 dollars would open spaces to go and test again the 120-115 area. Whereas to go upwards, a recovery of $155 is required.
