


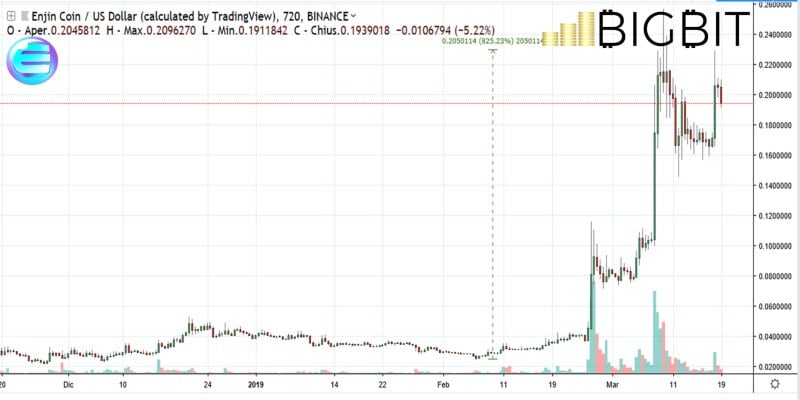
Today, March 19th, 2019, marks the upward movement in the price of Stellar Lumens (XLM), which this morning rose by more than 5%. Enjin Coin continues to rise again, returning to the highs reached last week.
These are the only two cryptocurrencies highlighting a bullish trend, followed at a distance by ZCash (ZEC) which today has risen by 2.5%.
All the others oscillate around parity, with a tendency towards negative territory but nothing of concern considering the increases of the last week. Among the top 50 cryptocurrencies, the only negative from last Tuesday’s values is Steem with a drop of 7%.
Whereas the best weekly performance is that of Bitcoin Cash, which manages to rise by more than 20%, followed by the price of Stellar Lumens (XLM) which benefits from the increases of the last 48 hours due to the listing on Coinbase.
Coinbase has added Stellar Lumens to its trading platform and this has had a positive effect on the price of the coin in 2019. XLM is the third crypto listed by Coinbase in the last quarter after Ethereum Classic (ETC) and Basic Attention Token (BAT),.
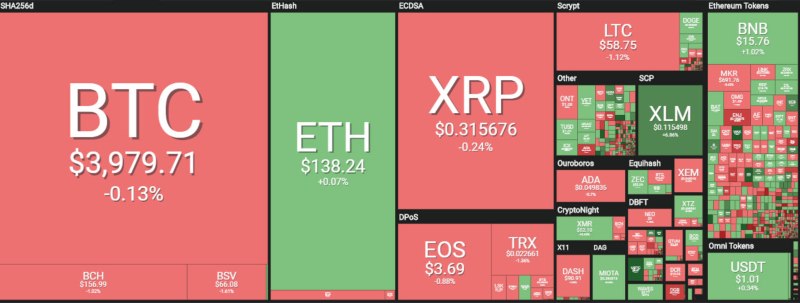
Capitalisation continues to fluctuate around $140 billion, with the last 24-48 hours showing an increase in overall trading volumes.
Bitcoin falls below 51% of dominance, confirming the trend in favour of altcoins like Litecoin and EOS that continue to gain market shares, as well as Stellar Lumens. All this to the disadvantage of the shares of bitcoin, Ether and XRP which remain in a declining phase.
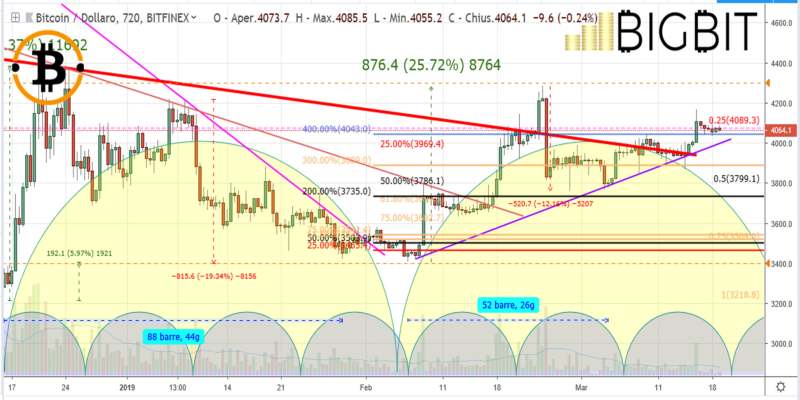
Price of Bitcoin (BTC)
Not much more to add to yesterday afternoon’s report. Prices remain at $4,000 but cannot go beyond $4,100-4,200, which are crucial resistance levels to trigger an upward leap in the near future. This goes against the setting of the next bimonthly cycle that moves towards the final phase estimated by early April.
Extensions below $3850-3700 become dangerous downwards as they would attract downward speculation with the probability of revising the lows of early February.

Value of Ethereum (ETH)
Even here, the technical situation remains substantially unchanged compared to the last 24 hours. The millimetric oscillations make the prices stay close to the 140 dollars not giving any useful indication in operational terms
The monthly trend of March 2019, which refers to the low of the beginning of February, continues to remain bullish.
The $155 quota remains decisive, as it would once again supply fuel for further bullish thrusts and attract new purchases. Instead, dropping below 120-115 dollars would be dangerous.
