


Today the king of technical analysis is not bitcoin, which continues its lateral movement that has been characterizing the last 3 days with oscillations at the threshold of 8,900 dollars, but its other sisters – including Bitcoin SV – that are attracting attention in the last 24 hours with triple-digit price increases.
Bitcoin Gold, in particular, rises by 20%, while Bitcoin SV is stabilising around the threshold of 50% after seeing a triple-digit rise during the night. Bitcoin Cash, on the other hand, rose 5% and updated its annual record, pushing over $480.
In particular, it is Bitcoin Satoshi Vision to draw attention due to its speculation, coinciding with the news released in the night. In an interview with Bloomberg one of the founders of the BSV fork, Calvin Ayre, stated that Bitcoin Satoshi Vision, despite the attacks, will cancel the other cryptocurrencies, including BTC, because BSV would comply with US law and will soon take over BTC’s dominant position.
In addition, there has been a further patent registration of the whitepaper that gave life to bitcoin. A few days after the one filed by Craig Wright last April 11, which was confirmed last week, the same whitepaper was filed on May 24 by an unknown person, Wei Liu, who has filed a second application for copyright registration.
This news and Ayre’s interview with Bloomberg, support the speculation on Bitcoin SV which today has found itself riding the volatility waves.
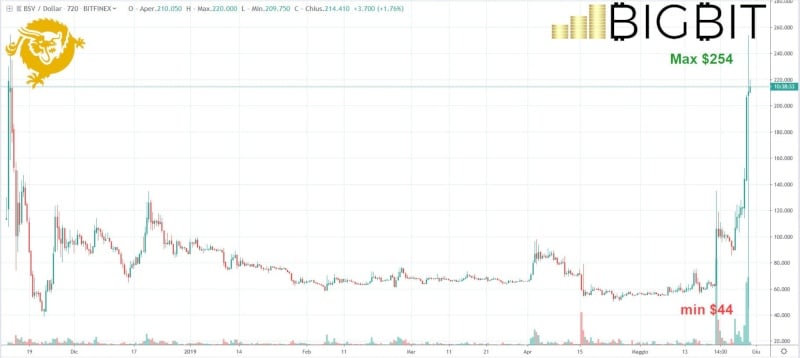
The speculation was mainly recorded on Bitfinex: at 11 European time (UTC+2) there was a “fat finger” that in a few minutes pushed the prices from the maximums of 250 dollars to just under 50 dollars, making volatility explode with a movement of 80%, which was then recovered in the following moments, with prices returning to 210 dollars. This shows how Bitcoin SV has been affected by price speculation in the past two weeks.
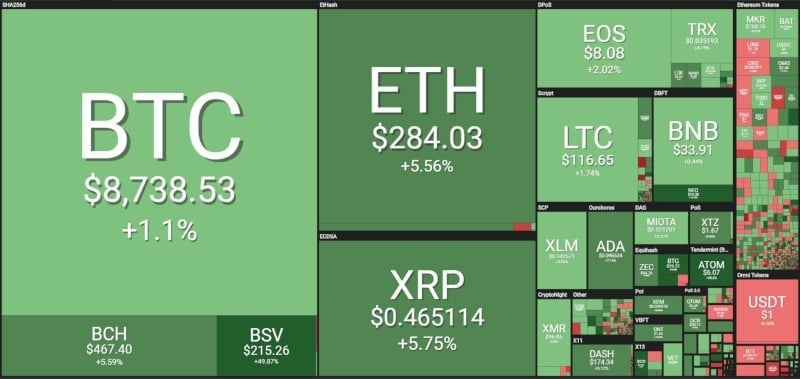
The sector remains decidedly oriented towards the upside. Over 70% of cryptocurrencies are above par. Today, Cosmos (ATOM) and ZCash (ZEC) stand out: the latter, with yesterday’s news of the launch of its wallet, reaches almost $100, reviewing levels abandoned last November 2018.
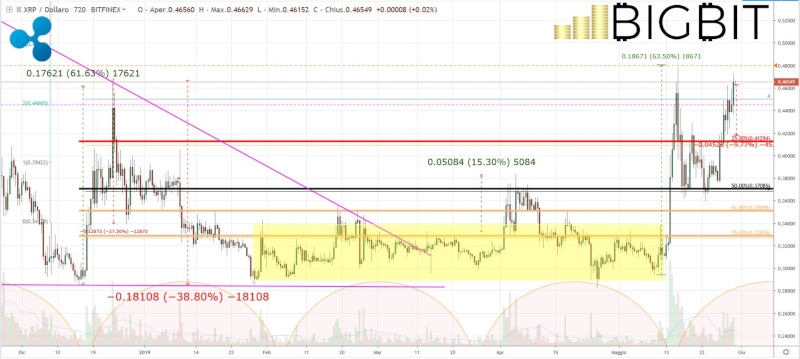
There are also increases for Ethereum and Ripple: Ripple returns above the threshold of 46 cents, levels which were last seen on May 16th, and previously at the end of December, testing technically a very important level of resistance.
The market cap rises above the threshold of 280 billion dollars, a new record in 2019 which was abandoned between July 31st and August 1st. Bitcoin’s dominance drops further by 2 percentage points, reaching just above the 55% threshold. This benefits Ethereum, which rises to 11%, and Ripple, which revises its 7% market share, abandoned in mid-May.
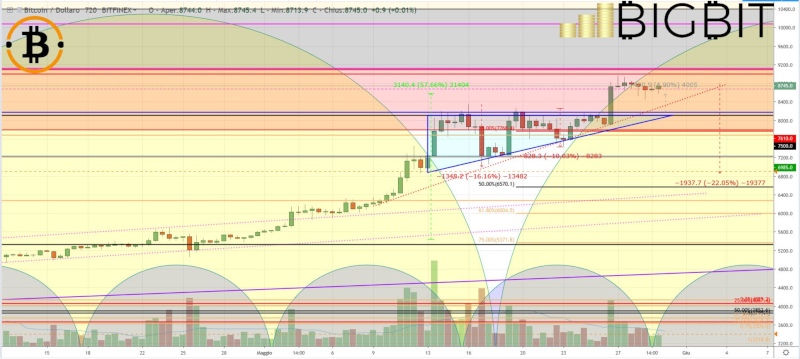
Price analysis Bitcoin (BTC)
Over the past three days bitcoin has been fluctuating between $8,750 and $8,850 without giving a signal that could give consolidation on these levels to attack $9,000 or indicate a phase of fatigue on the part of buyers resulting in a decrease in purchases with a possible return to test the previous resistance of $8,250 violated last Sunday.
A possible break of the 8,500 dollars would see a first test of the support at 8,250 dollars and then the most important psychological level at $8000. The most important reference level is $6800, a level very far from the current prices (20%). So there is ample room for speculative downward movements that would not affect the excellent bullish structure that began in April and is preparing to close with a rise of more than 65%.
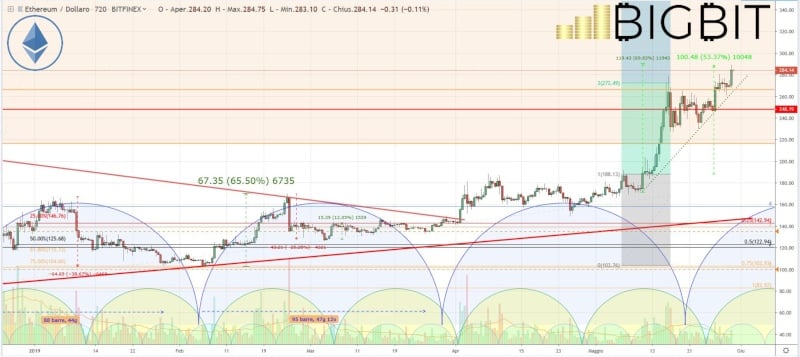
Price analysis Ethereum (ETH)
During the first lights of the dawn, ethereum has seen the price update the records of 2019 reaching close to $290, a decidedly upward movement that confirms the bullish structure that began from the lows of May and that sees prices rise by more than 70% in just under 20 days.
It is a bullish structure that gives hope for the month of June. For ETH it will be important to confirm the support between 230 and 255 dollars before celebrating, an area of fluctuation in which prices moved last week.
For ETH, breaking $290 in the next few hours would attract the psychological $300 level. Downwards it is important not to go below the indicated levels of $255 and then $235. A seal of these supports would give confirmation of an excellent bullish movement.
