


After 7 days, we start this new week from last Monday’s levels: where has the famous crypto volatility gone?
Only Ripple (XRP) and Tron (TRX) differ from the other main altcoins with double-digit movements. Compared to last Monday’s levels, Ripple loses the support of $0.50 and marks a decline of over 11%, while Tron (TRX) climbs above $0.0266, recovering over 22%.
Although the day moves in general apathy, a sentiment that has been present for several days, green signs prevail.
Among the first 100 listed on Coinmarketcap, only 10% move below par and there are only 3, semi-unknown to many, with movements of more than 3%: DigixDAO (DGD), Electroneum (ETN) and ReddCoin (RDD).
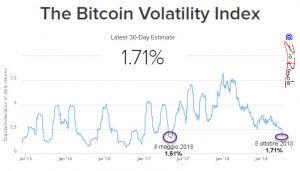
On Saturday the volumes traded on bitcoin have touched the lowest point since October 2016: this is a condition that goes hand in hand with the crypto volatility that continues to fall, touching the lowest point of the last 16 months.
From the chart below you can see how the volatility, over the past few months, has gone from a daily average above 5% to 1.71%. A collapse of several percentage points that breaks down the commonplace that has always accompanied cryptocurrencies: the high volatility.
Statistics indicate that periods of low volatility on bitcoin had a duration of 1-2 weeks, followed by sudden explosion in prices.

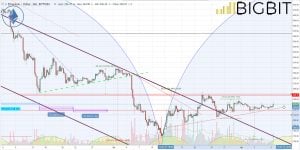
Bitcoin (BTC)
Despite the low volumes, the price of the queen of cryptocurrencies tries to attack the bearish trendline that unites the relative maximums of the last months: it is a trendline that passes in the 6700 dollars area. The breaking up of this level could give a shock to the low volume trades present also in these first hours of the new week.
The short-term trend remains bullish, but confirmations above 6700-6800 dollars are needed. A return below 6500 dollars must not be accompanied by further extensions below 6200, otherwise the chances of new falls increase.
Ethereum (ETH)
Like BTC, ETH prices also return to test the resistance of 230 dollars. It is necessary to extend up to the 250 dollars area, otherwise, we will continue to oscillate in a limbo that from the end of September has been forcing prices in a lateral channel without direction.
