

Summary
Bitcoin Analysis
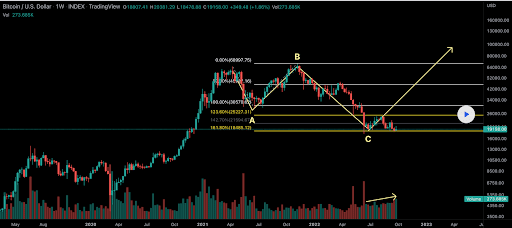
The volatility around the price of Bitcoin has cooled off of late and the asset’s been trading between $18,790-$22,395 for the last 30 days. Bulls successfully closed another week above the $19k level but again finished another week below $19,891, a major level of inflection.
When Sunday’s daily session wrapped-up, BTC’s price was -$254.3.
We’re beginning a fresh week by looking at the BTC/USD 1W chart below from dudebruhwhoa. BTC’s price is trading between the 161.80% fibonacci level [$18,485.12] and the 142.70% fib level [$21,594.62], at the time of writing.
Bullish market participants are hoping that they’re successfully setting up bears for a trap but it will be critical to hold the 161.80% fib level for that to materialize. The overhead targets for bulls are 142.70%, 123.60% [$25,227.31], 100.00% [$30,570.62], 50.00% [$45,927.16], and 0.00% [$68,997.75].
From the perspective of bears, they want to again push BTC’s price back down to test the 161.80% fib level before pushing its price below that level and taking it back down to retest the 12-month low of $17,611.
Bitcoin’s Moving Averages: 5-Day [$19,337.06], 20-Day [$19,659.75], 50-Day [$21,294.43], 100-Day [$22,946.89], 200-Day [$31,936.88], Year to Date [$31,528.22].
BTC’s 24 hour price range is $18,920.4-$19,395.9 and its 7 day price range is $18,548.96-$20,296.07. Bitcoin’s 52 week price range is $17,611-$69,044.
The price of Bitcoin on this date last year was $48,243.
The average price of BTC for the last 30 days is $19,767.9 and its -4% for the same period.
Bitcoin’s price [-1.32%] closed its daily candle worth $19,057.5 and in red figures for a third consecutive day.
Ethereum Analysis
Ether’s price marked-down more than twice as much as Bitcoin’s price on Sunday and when traders settled-up for Sunday, ETH’s price was -$36.26.
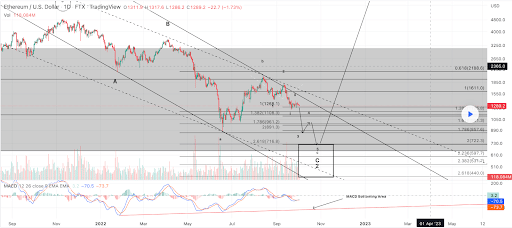
We continue our price analyses this Monday with the ETH/USD 1D chart by maikisch. ETH’s price is trying to hold the 1 fib level [$1,268.1], at the time of writing.
If bullish traders fail to break out of this descending channel a three figure ETH price may be forthcoming before year’s end.
The targets to the downside for bearish ETH traders are the 1 fib level followed by 1.382 [$1,108.3], 1.786 [$961.2], 2 [$891.3], and 2.618 [$716.8].
ETH’s 24 hour price range is $1,263.04-$1,317.93 and its 7 day price range is $1,263.04-$1,393.48. Ether’s 52 week price range is $883.62-$4,878.
The price of ETH on this date last year was $3,416.18.
The average price of ETH for the last 30 days is $1,471.97 and its -17.98% over the same duration.
Ether’s price [-2.76%] closed its daily candle on Sunday valued at $1,275.52 and finished in red figures for four straight days.
Near Protocol Analysis
Near Protocol’s price also took a step backward on Sunday from the perspective of bulls and finished Sunday’s daily candle -$0.07.
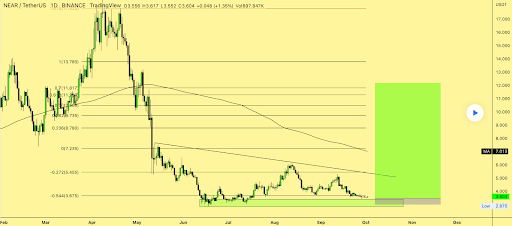
The NEAR/USDT 1D chart below from Trader_Needs is the last chart we’re analyzing today. NEAR’s price is at a pivotal level again and bullish traders need to regain the -0.554 [$3.67]. If they fail to do so, they risk another trip back below the $3 level and a retest of the $2.87 level.
The primary target overhead is now the -0.554 fibonacci level with more targets above of -0.272 [$5.45], 0 [$7.23], and 0.236 [$8.70].
NEAR’s 24 hour price range is $3.41-$3.61 and its 7 day price range is $3.41-$3.8. Near Protocol’s 52 week price range is $2.89-$20.44.
NEAR’s price on this date last year was $8.02.
The average price of NEAR over the last 30 days is $4.08 and its -19.87% for the same stretch.
Near Protocol’s price [-2.14%] closed in red digits for a third consecutive day and was worth $3.48 when Sunday’s trading session concluded.