Summary
Bitcoin back above $50k
Bitcoin’s bulls were able to send BTC’s price back above $50k on Sunday and BTC closed its daily candle +$759.9.
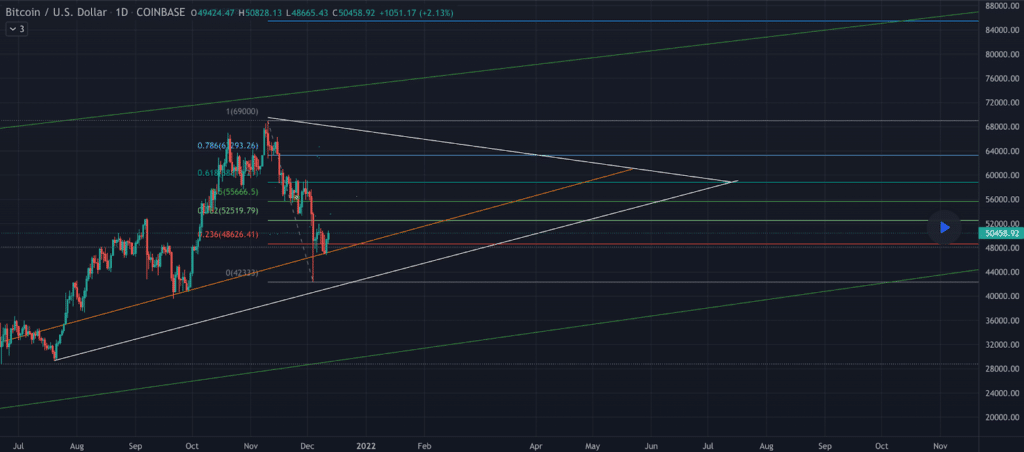
The BTC/USD 1D chart below from CryptoDonk2021 shows the local battlegrounds for traders of bitcoin.
For bullish traders their primary focus is to hold the .236 [$48,626.41] and again reclaim the .0382 [$55,666.5]. Above that level is the 0.5 fib level [$55,666.5] and the .618 at [$58,812].
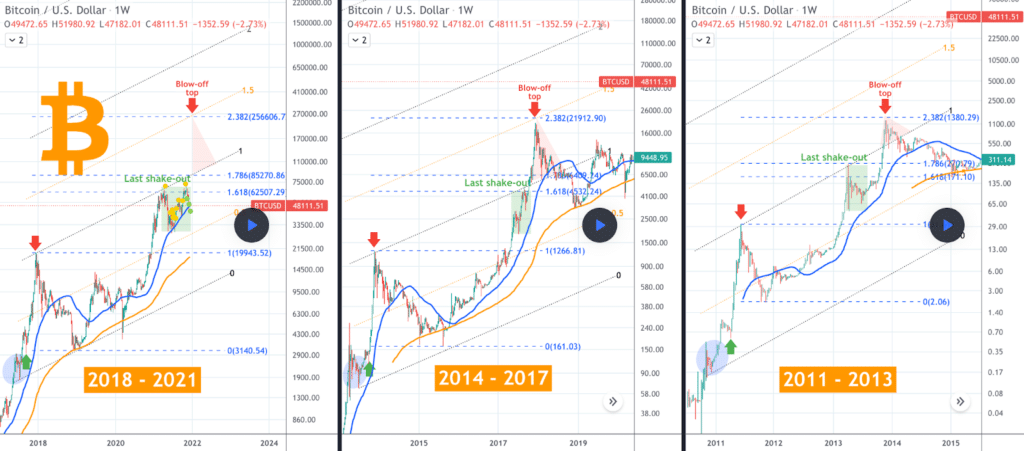
Another chart for traders to consider is the 1W chart from TradingShot. This chart details the previous two bitcoin cycles to this one, each time BTC capped its run at the 2.382 fibonacci level. The 2.382 if BTC does reverse to the upside and make a new high is $256,606.7.
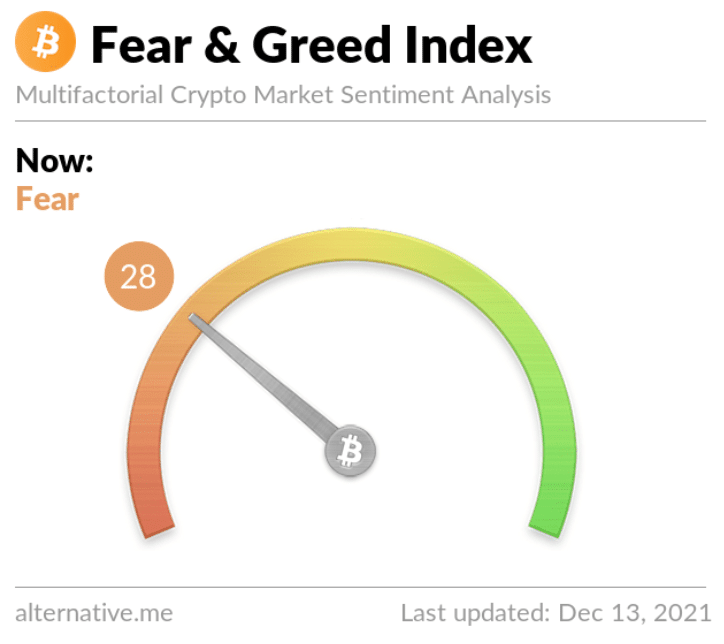
The Fear and Greed Index is 28 Fear and +1 from Sunday’s reading of 27 Fear.
Bitcoin’s moving averages are as follows: 20 Day MA [$55,716], 50 Day MA [$58,521], 100 Day MA [$51,720], 200 Day MA [$48,797].
BTC’s 24 hour price range is $48,504-$50,862 and its 7 day price range is $47,303-$51,855. Bitcoin’s 52 week price range is $18,747-$69,044.
The price of bitcoin on this date last year was $18,807.
The average price of BTC for the last 30 days is $55,963.
Bitcoin [+1.54%] closed its daily candle worth $50,123 and in green figures for a second straight day.
Ethereum Analysis
Ether’s price closed back above $4k for a second straight day after closing Friday below $4k for the first time in the last 30 days. ETH closed Sunday’s daily candle +$56.61.
Ether traders may gain some insights from the 1D ETH/USD chart below Champion-Vibe. Ether’s price is currently trading near the bottom of its descending channel dating back to early November.
It’s important for bulls to control and hold the .382 [$4,171] and then regain the .5 fib level [$4,230]. Above that level is the .618 fib level [$4,440] that if regained could shift momentum back to Ether bulls for the interim.
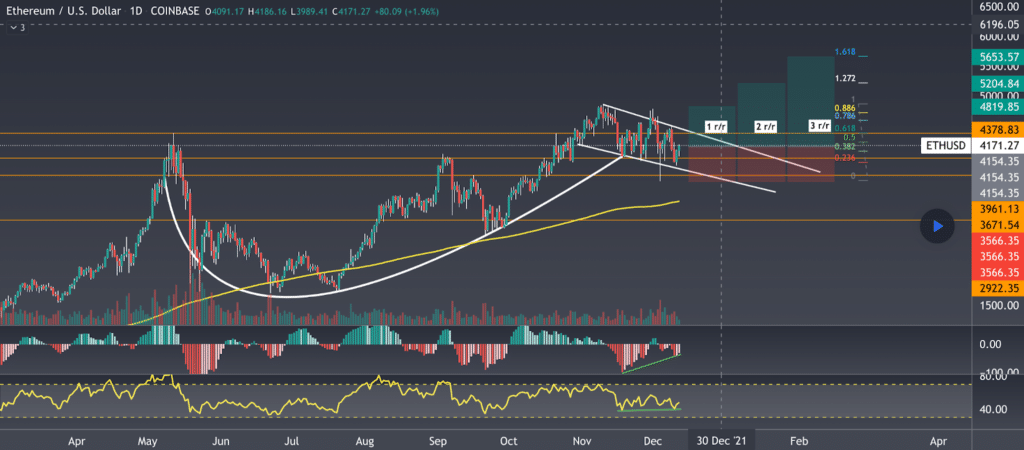
Ether bears conversely are attempting to send ETH’s price back below the .382 and test the .236 fib level [$3,890].
Ether’s moving averages are as follows: 20 Day MA [$4,312], 50 Day MA [$4,176], 100 Day MA [$3,640], 200 Day MA [$3,002].
ETH’s 24 hour price range is $3,998-$4,172 and its 7 day price range is $3,918-$4,458. Ether’s 52 week price range is $565.22-$4,878.
The price of ETH on this date in 2020 was $568.36
The average price of ETH for the last 30 days is $4,310.
Ether [+1.39%] closed its daily candle on Sunday worth $4,131.84.
CRO Analysis
Crypto.Com Coin’s price closed its daily candle on Sunday +$.026.
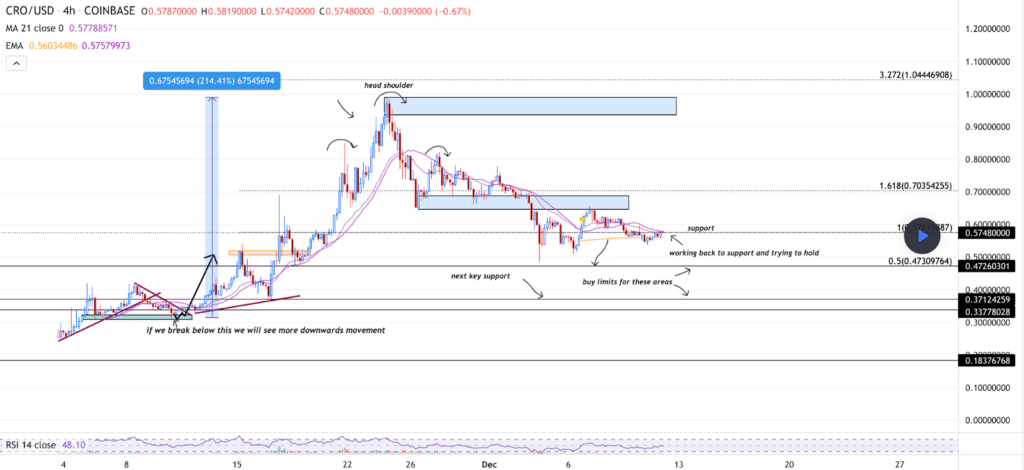
The CRO/USD 4hr chart below from Buildyourassets shows CRO bulls trying to hold support at the 1 fib level [$.57]. Overhead bulls are trying to send CRO’s price back above 1.618 [$.703].
Bearish CRO traders on the other hand want to break bullish support at $.57 and test the next fib lower at .5 [$.47].
Over the last 12 months CRO is +894.8% against The U.S. Dollar, +276.3% against BTC, and +38.95% against ETH for the same duration.
CRO’s 24 hour price range is $.571-$.615 and its 7 day price range is $.516-$.654. Crypto.com Coin’s 52 week price range is $.054-$.965.
CRO’s price on this date last year was $.059.
The average price for CRO over the last 30 days is $.617.
CRO [+4.52%] closed its daily candle worth $.602 on Sunday for a second straight day.


