Summary
Bitcoin Analysis
On Wednesday bitcoin’s price bearishly engulfed the daily timescale and finished its daily session -$1,808.
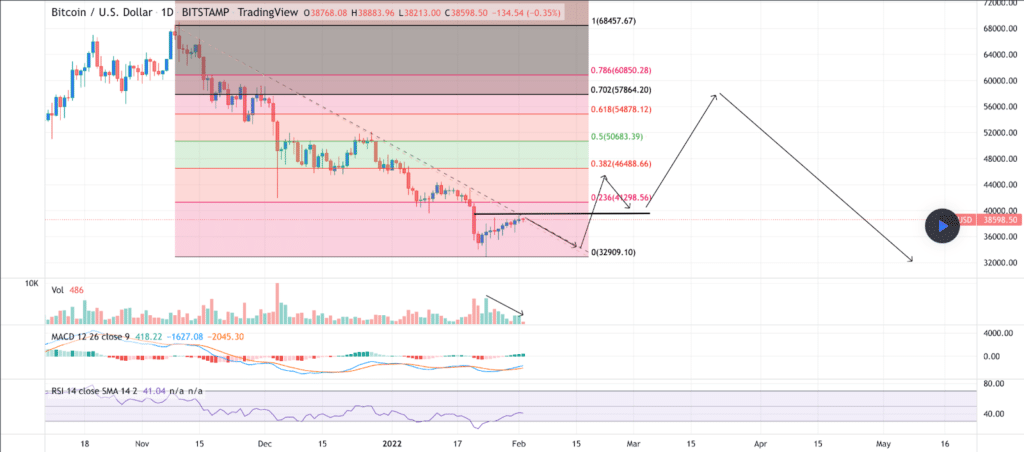
The BTC/USD 1D chart below from TheVortexTrader shows BTC’s price still range bound between the 0 fib level [$32,909.1] and 0.236 [$41,298.56]. Bearish BTC traders have successfully been able to defend an important level of inflection between $39k-$41,298 thus far. They’re now aiming at reversing course back down to a full retracement at the $32k level. If bearish traders succeed at again pushing BTC’s price lower, they’ll next try to break the $29k level which was the bottom of the market in 2021.
From the perspective of bullish BTC traders, they need to muster enough momentum and volume to crack the $41,3k level and flip it from resistance back to support. If they do break that level successfully, the next overhead resistance for bulls is at 0.382 [$46,488.66] with a third target of 0.5 [$50,683.39].

Bitcoin’s Moving Averages: 20-Day [$40,061.81], 50-Day [$46,118.16], 100-Day [$51,158.27], 200-Day [$46,319.9], Year to Date [$40,745.57].
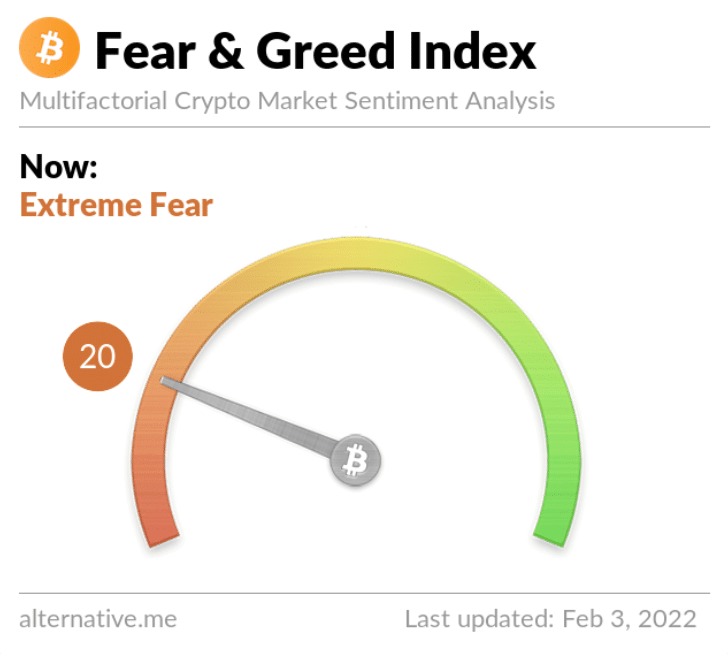
The Fear and Greed Index is 20 Extreme Fear and -8 from Wednesday’s reading of 28 Fear.

BTC’s 24 hour price range is $36,849-$38,900 and its 7 day price range is $35,622-$39,048. Bitcoin’s 52 week price range is $29,341-$69,044.
The price of bitcoin on this date last year was $37,494.
The average price of BTC for the last 30 days is $40,694.
Bitcoin’s price [-4.67%] closed its daily candle worth $36,925 on Wednesday.
Ethereum Analysis
Ether’s price also marked down on Wednesday and closed its daily candle -$106.23.
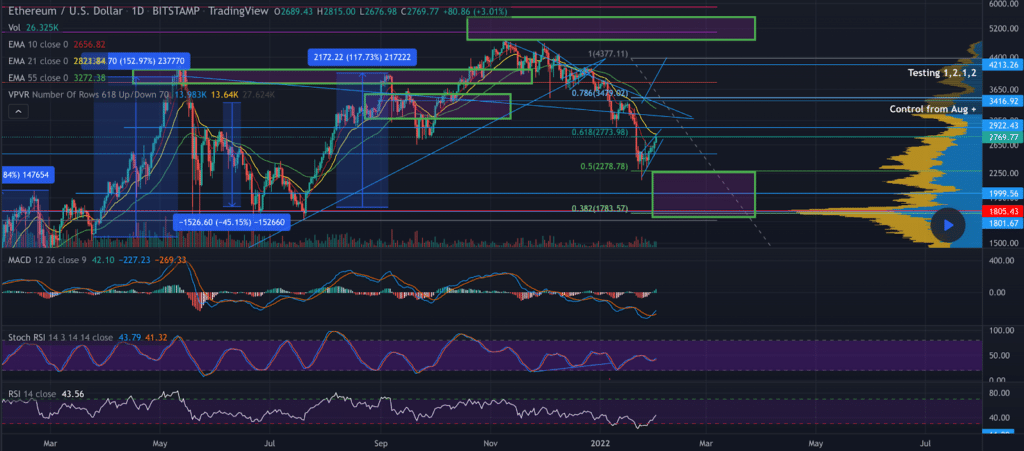
The ETH/USD 1D chart below from mouthwash shows Ether’s price mimicking BTC’s price in regards to being rejected by overhead resistance at the 0.618 fib level [$2,773.98]. Market participants that are particularly bearish or short ETH are aiming to send ETH’s price back down to retest 0.5 [$2,278.78] with a secondary target at 0.382 [$1,783.57].
Conversely, if bullish ETH market participants do manage to crack 0.618, their next target overhead is 0.786 [$3,479.02]. The third overhead resistance for bullish Ether traders is 1 [$4,377.11] which would potentially be a level with a lot of historical price action to overcome when looking to the left of the chart.

Ether’s Moving Averages: 20-Day [$2,917.86], 50-Day [$3,608.74], 100-Day [$3,737.53], 200-Day [$3,256.85], Year to Date [$3,020.53].
ETH’s 24 hour price range is $2,636-$2,807 and its 7 day price range is $2,353-$2,807. Ether’s 52 week price range is $1,353-$4,878.
The price of ETH on this date in 2021 was $1,587.
The average price of ETH for the last 30 days is $3,010.
Ether’s price [-3.81%] closed its daily candle worth $2,680.68 on Wednesday and broke up a streak of five straight daily candle closes in green figures.
Polkadot Analysis
Polkadot’s price finished its session on Wednesday in negative figures and -$0.80.
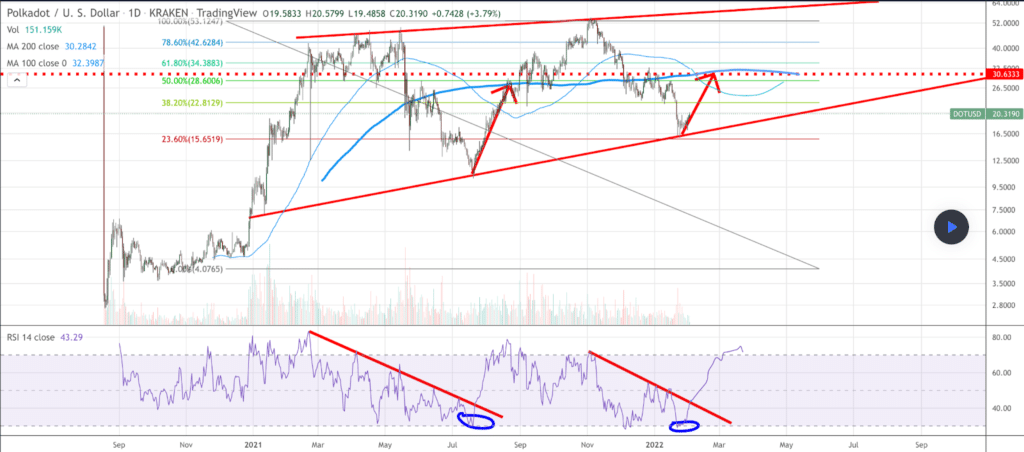
Polkadot’s price has been trending higher over the past week but will this trend continue with the aggregate market cap’s rejection of $1.79 trillion on Wednesday. Today we’re looking at the DOT/USD 1D chart below from samideluxe.
Bullish Polkadot market participants are firstly seeking to break the 38.20% fib level [$22.81] with a secondary target of 50.00% [$28.60]. If bullish DOT traders can break the $29 level the next target is the 61.80% fib level [$34.38].
The primary bearish target is to crack the 23.60% fib because below that price there isn’t major support until a full retracement at 0.00% [$4.07].

Polkadot’s price has been trending higher over the past week
Polkadot’s Moving Averages: 20-Day [$22.38], 50-Day [$26.80], 100-Day [$33.19], 200-Day [$28.53], Year to Date [$23.20].
Polkadot’s 24 hour price range is $18.79-$20.57 and its 7 day price range is $17.23-$20.57. DOT’s 52 week price range is $10.37-$54.98.
Polkadot’s price on this date last year was $19.69.
The average price for DOT over the last 30 days is $23.15.
Polkadot’s price [-4.11%] snapped a two day candle close streak in green figures on Wednesday and finished its daily candle worth $18.77.


