Summary
Bitcoin Analysis
Bitcoin’s price sold-off during the day’s final 4HR candle and concluded its daily session -$1,130.1.
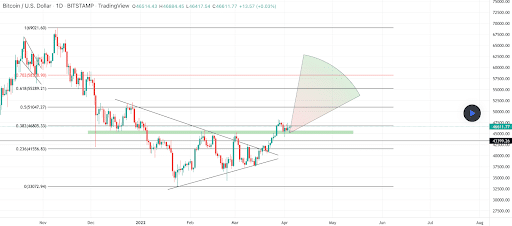
The first chart to analyze on today’s agenda is the BTC/USD 1D chart below from Satoshi_Nakaschwartzhouse. BTC’s price has been trading above the 0.236 fibonacci level [$41,556.83] on the daily timescale since the end of March and is now trying to successfully defeat bearish traders at the 0.382 fib level [$46,805.33].
The targets overhead for bullish BTC traders are 0.382, 0.5 [$51,047.27], and 0.618 [$55,289.21].
For those expecting downside for BTC’s price next, the targets are 0.236, and a full retracement back to 0 [$33,072.94].
Bitcoin’s Moving Averages: 5-Day [$46,433.65], 20-Day [$43,210.67], 50-Day [$41,475.30], 100-Day [$45,020.1], 200-Day [$46,364.8], Year to Date [$41,588.19].
BTC’s 24 hour price range is $45,635-$47,077 and its 7 day price range is $44,347-$47,651. Bitcoin’s 52 week price range is $29,341-$69,044.
The price of bitcoin on this date last year was $58,706.
The average price of BTC for the last 30 days is $42,579.5.
Bitcoin’s price [-2.42%] closed its daily candle worth $45,481 and in red figures for the first time in three days.
Ethereum Analysis
On Tuesday, Ether’s price was pushed lower by bearish traders and ETH’s price was -113.36 after traders had settled up for the daily session.
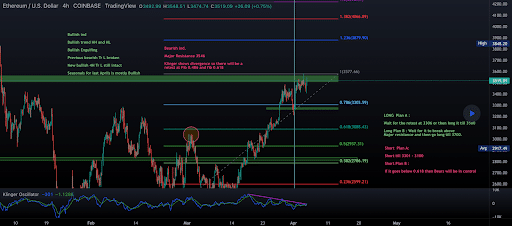
The second chart we’re looking at today is the ETH/USD 4HR chart below from ik05007. Ether’s price is trading between 0.786 [$3,303.59] and 1 [$3,577.66], at the time of writing.
The primary target for bullish traders to the upside is the 1 fib level followed by 1.236 [$3,879.90] and a third target of 1.382 [$4,066.89].
Bearish Ether market participants are looking to defend the bottom of the current range at the $3,5k level and deny bulls any territory above the 1 fib level. If they’re successful at reversing the course of ETH’s price, the targets to the downside are 0.786, 0.618 [$3,088.43], and 0.5 [$2,937.31].
ETH’s 24 hour price range is $3,421-$3,543 and its 7 day price range is $3,220-$3,559. Ether’s 52 week price range is $1,719-$4,878.
The price of ETH on this date in 2021 was $2,097.8.
The average price of ETH for the last 30 days is $2,975.4.
Ether’s price [-3.22%] closed its daily candle on Tuesday worth $3,407.03 and in red digits for the third time in three days.
Algorand Analysis
Algorand’s price sold-off by more than 5% for a second straight day and concluded its daily session -$0.049.
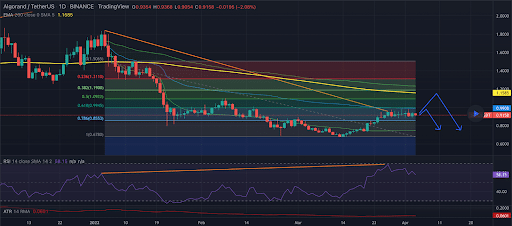
The third chart we’re looking at today is the ALGO/USD 1D chart below by CallMeBeginnerTheExplorer. ALGO’s price is trading between 0.786 [$0.855] and 0.618 [$0.994], at the time of writing.
Looking overhead bullish ALGO traders are looking to snap the 0.618 with a secondary aim of 0.5 [$1.09] and a third target of 0.382 [$1.19].
Bearish ALGO traders are looking to push ALGO’s price below the 0.786 fib level then shift their focus to 1 [$0.678].
ALGO’s price is -33.31% against The U.S. Dollar for the last 12 months, -17.71% against BTC, and -60.99% against ETH over the same duration.
Algorand’s 24 hour price range is $0.843-$0.898 and its 7 day price range is $0.843-$0.983. ALGO’s 52 week price range is $0.674-$3.56.
Algorand’s price on this date last year was $1.40.
The average price of ALGO over the last 30 days is $0.816.
Algorand’s price [-5.54%] closed its daily candle worth $0.834 on Tuesday and in red figures for a second straight day.


