

Bitcoin (BTC) price Analysis
Bitcoin’s price narrowly avoided a fifth straight daily candle close in red figures and concluded its daily session +$39.30.
The BTC/USD 1M chart below from ali_1673 shows BTC’s price trading between the 1.618 Fibonacci level [$33,471.85] and 2 [$57,698.36], at the time of writing.
The targets to the upside for bullish BTC traders are the 2 fibonacci level and 2.272 [$85,025.61].
Conversely, the targets for bearish BTC traders are 1.618 [$33,471.85], 1.272 [$20,440.07] and 1 [$13,870.63].

The Fear and Greed Index is 23 Extreme Fear and is -1 from yesterday’s reading of 24 Extreme Fear.
Bitcoin’s Moving Averages: 5-Day [$40,721.92], 20-Day [$43,080.35], 50-Day [$41,730.65], 100-Day [$42,932.71], 200-Day [$46,876.89], Year to Date [$41,505.09].
BTC’s 24 hour price range is $39,298-$39,871 and its 7 day price range is $38,779-$42,736. Bitcoin’s 52 week price range is $29,341-$69,044.
The price of bitcoin on this date last year was $50,133. The average price of BTC for the last 30 days is $42,984.
Bitcoin’s price [+0.10%] closed its daily candle worth $39,486 on Sunday.
BTC price Analysis
Bitcoin’s Moving Averages: 5-Day [$40,721.92], 20-Day [$43,080.35], 50-Day [$41,730.65], 100-Day [$42,932.71], 200-Day [$46,876.89], Year to Date [$41,505.09].
BTC’s 24 hour price range is $39,298-$39,871 and its 7 day price range is $38,779-$42,736. Bitcoin’s 52 week price range is $29,341-$69,044.
The price of bitcoin on this date last year was $50,133. The average price of BTC for the last 30 days is $42,984.
Bitcoin’s price [+0.10%] closed its daily candle worth $39,486 on Sunday.
Ethereum (ETH) price analysis

Ether’s Moving Averages: 5-Day [$3,031.75], 20-Day [$3,196.75], 50-Day [$2,956.48], 100-Day [$3,184.44], 200-Day [$3,354.75], Year to Date [$2,980.77].
ETH’s 24 hour price range is $2,926-$2,964 and its 7 day price range is $2,898-$3,167. Ether’s 52 week price range is $1,719-$4,878.
The price of ETH on this date in 2021 was $2,212. The average price of ETH for the last 30 days is $3,179.03.
Ether’s price [-0.34%] closed its daily candle on Sunday worth $2,922.01 and is -6.04% for the last 30 days.
Polkadot (DOT) price Analysis
Polkadot’s price closed the weekend with a red daily candle after DOT’s price finished in green figures on Friday and Saturday. DOT’s price closed Sunday’s daily session -$0.49.
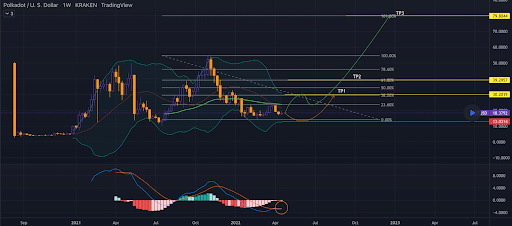
The DOT/USD 1W chart below from thecryer illuminates how rough the last few months have been for bullish traders of DOT.

DOT’s price is trading between the 0.00% fib level [$14.10] and 23.60% fib level [$23.63], at the time of writing.
The targets to the upside for bullish traders of DOT are 23.60%, 38.20% [$29.62], and 50.00% [$34.49].
Bearish traders are looking for a full retracement back to the $14 level before attempting to send DOT’s price back to single digits on the weekly timescale.
Polkadot’s Moving Averages: 5-Day [$18.55], 20-Day [$19.88], 50-Day [$18.85], 100-Day [$21.71], 200-Day [$27.05], Year to Date [$20.27].
Polkadot’s 24 hour price range is $18.13-$19.15 and its 7 day price range is $17.20-$19.51. DOT’s 52 week price range is $10.38-$54.98.
Polkadot’s price on this date last year was $29.14.
The average price of DOT over the last 30 days is $19.99.
Polkadot’s price [-2.63%] closed its daily candle on Sunday valued at $18.17 and DOT’s price is -14.58% for the last 30 days.

