


Fibonacci levels are undoubtedly one of the most fascinating theories of financial trading. The numbers of the Fibonacci Series respond to a simple mathematical property according to which each of them is defined as the sum of the two previous ones.
Over the years, several indicators have emerged, including Fibonacci levels, fans and arcs.
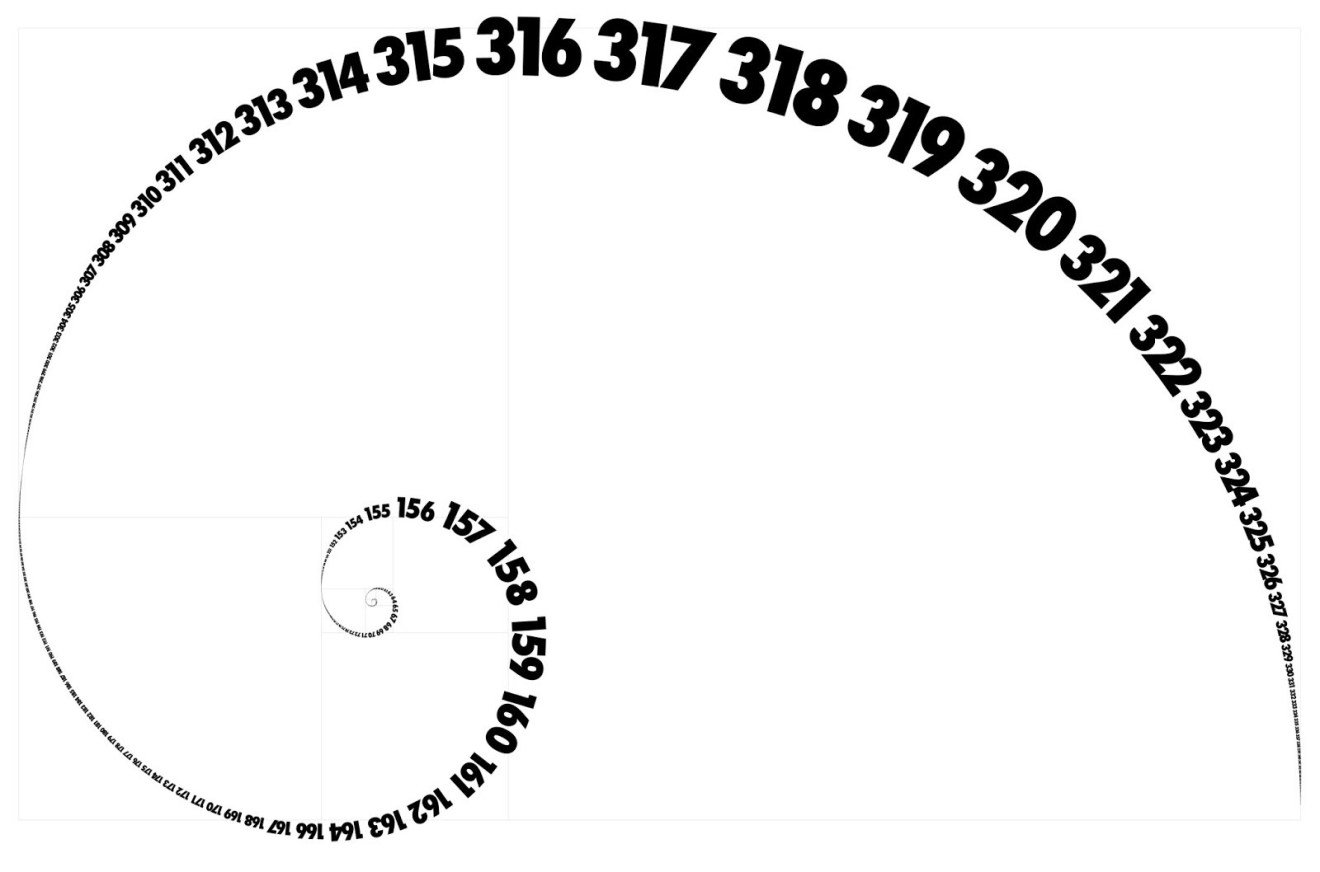
The sequence starts this way:
1, 1, 2, 3, 5, 8, 13, 21, 34, 55, 89, 144
And it’s, of course, infinite.
The history
Leonardo Pisano, called Fibonacci, was a 13th-century mathematician who named the Fibonacci sequence after himself. He was able to develop this series through numerous teachings in the field of arithmetics.
This knowledge was summarised by him in an important text: the Liber Abaci. It was in this very piece of work that he introduced his thoughts. This numerical sequence is used in many fields: from music to computer science, from finance to nature, from mathematics to electronics.
In financial trading: what is the Fibonacci sequence for?
By dividing the Fibonacci numbers between them, we obtain the so-called Fibonacci ratios. If, for example, 13 is divided by 21, the result is 0.619 (expressed as a percentage it represents 61.9%).
These ratios are also taken into consideration in finance: the prices of assets do not move in a linear manner but according to very precise rules. It, therefore, happens that during a bullish movement there are several corrections or short phases of consolidation, while within a bearish movement there are several rebounds.
Fibonacci retracements are used, among other things, to determine support and resistance levels. They are based on a line drawn between a relative maximum and minimum (or vice versa).
Fibonacci levels
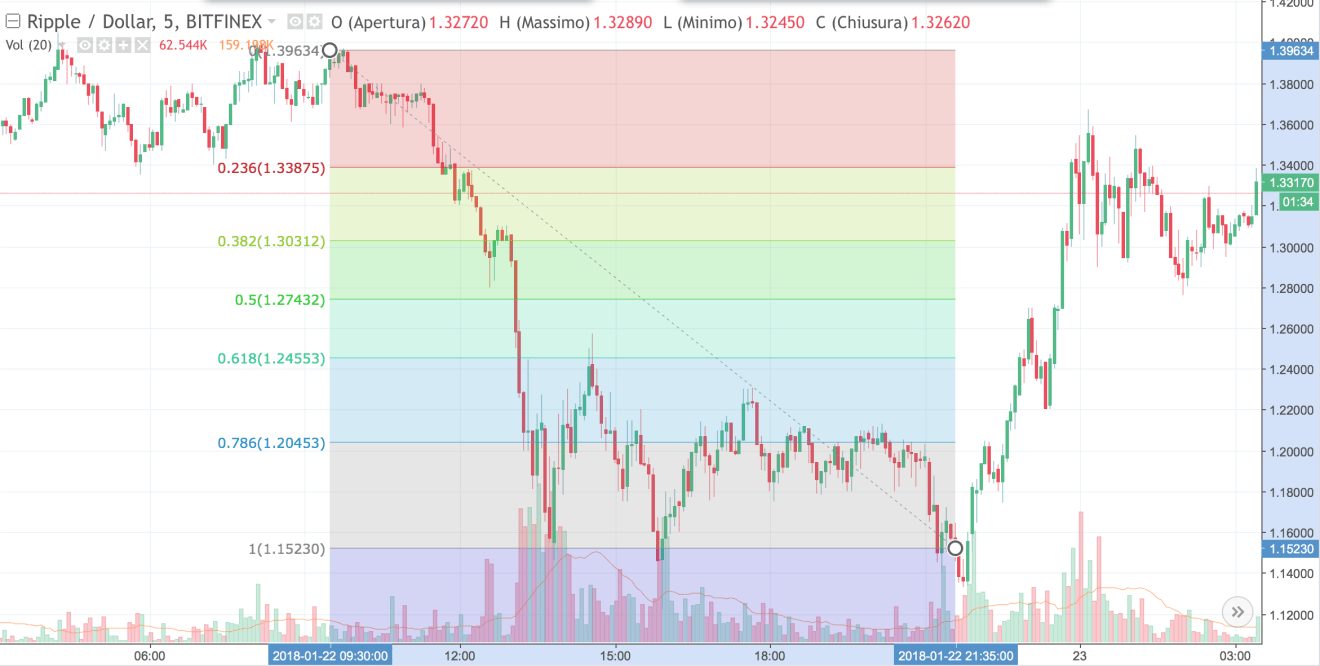
Many people agree that the most likely retracements after a bullish or bearish rally can be traced back to relationships derived from the Fibonacci series:
23.6%, 38.2%, 50%, 61.8% e 76.4%.
According to this observation, it is therefore plausible that a bullish movement is followed by a correction that will tend to stop after having walked in the opposite direction a portion of the space originally gained, indicated by one of the potential retracement percentages.
As can be seen in the graph, taking into account two points of maximum and minimum, it is possible that the supports and resistances follow perfectly, or almost, the Fibonacci levels.
Fibonacci fans
Fibonacci fans are based on the percentage retracements of the trend, respectively 38%, 50% and 62% above and below the line joining a relative historical minimum and a subsequent relative historical maximum, or vice versa.
In this way, the possible levels of inclination of the trend on which the price could react are identified. As with Fibonacci retracements, fans must be generated by selecting two points on the graph resting on the minimum and maximum of the period under consideration.
Other applications in trading
Not only levels and fans, but this indicator is also used for timing in futures markets. For this purpose, an asset and a new minimum or maximum point can be selected and moved forward along the axis of the x-axis in correspondence to the Fibonacci numbers. So, for example, 21, 34, 55 days ahead.
Many traders act on this information, believing that there is a repetition of events in conjunction with the sequence. But this does not always happen. In the same way, it is possible to take into consideration the intervals of days equal to the numbers of the Fibonacci sequence to see if there is any logic in the shape of charts.
Another use that is possible, linked to that of the fans, are the arcs.
Fibonacci arcs have fan lines in common with the fans and consist of three arcs at fixed intervals of 38.2%, 50% and 61.8%.
The price zones that are identified are possible areas of support or resistance that change with the passage of time. These arcs are obtained by pointing a compass at a historical maximum and drawing three concentric circles.
Do Fibonacci levels really work?
Fibonacci is a mathematical sequence and as such, it is well tested and verified.
Over the years, mathematicians and philosophers have always wondered why this series, along with the golden ratio, represents most of the phenomena on the planet.
However, some applications are experimental and others are almost religious. These mechanisms work, but it is a good idea to always accompany them with other technical indicators to avoid false signals.

