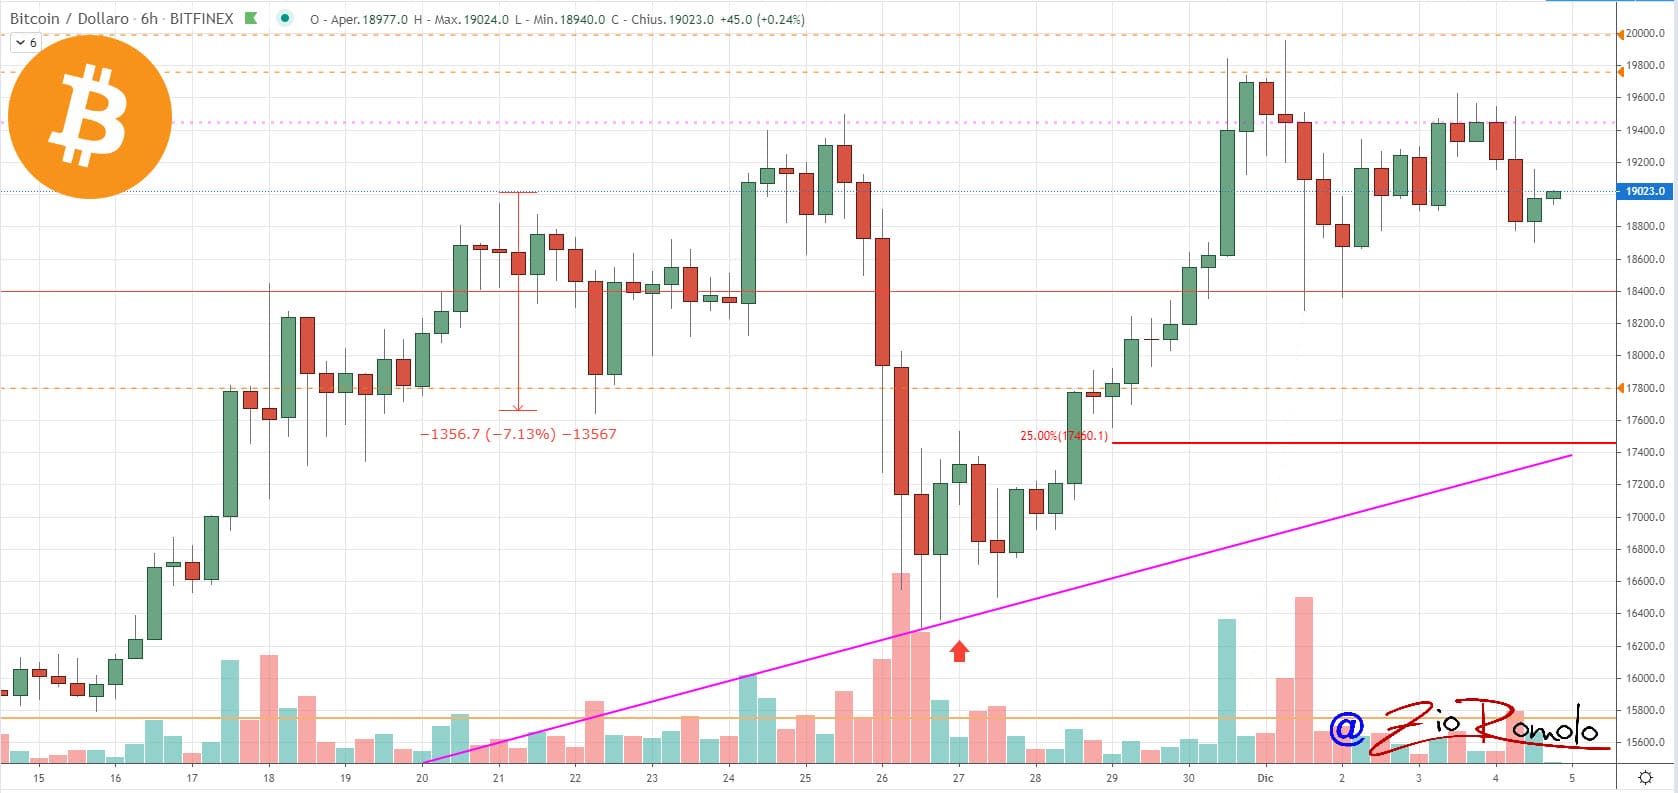
The climb that between Monday and Tuesday has updated the absolute historical highs for the price of Bitcoin and for a few dollars failed to exceed 20,000 USD, is beginning to accompany the weekly closing with a positive sign.
Scrolling the ranking of the first 100 capitalized, the weekly balance of their value is above par with many double-digit increases taking as reference data from the last seven days, including Bitcoin and Ethereum, both up more than 13% from last Friday’s levels.
The best weekly increase is for Nexo, with a rise of over 75%. Followed by Aave (formerly LEND) and Compound up 40%. Among the few declines, there is Stellar (XLM), down more than 8% from last week’s levels.
In the meantime, the total capitalization fell $25 billion from the highs recorded at the beginning of the week to below $565 billion. Bitcoin’s market share remains unchanged at 62%, while Ethereum recovers 12% and Ripple XRP slips to 4.6% from last week’s levels.
The total value locked in decentralized protocols remains just below yesterday’s high of $14.8 billion. As the value of Bitcoin increases, the WBTC asset protocol rises above $2.3 billion, beginning to undermine the leadership of the Maker loan protocol at just over $2.7 billion.
Bitcoin price
A weekly closure (11:59 PM UTC on Sunday) above USD 19,000 would provide a technical signal of strength for the value of Bitcoin.
From these heights there are now few points of reference upwards as a rise above 20,000 USD would see prices enter unexplored territory. It is better to observe the holding of the short and medium-term supports to understand if there is still the bullish fuel necessary to provide the next upward impulse.
A descent below the recent lows of $18,500 would open the way for a descent to revise the end of November lows at $16,500.

Ethereum price
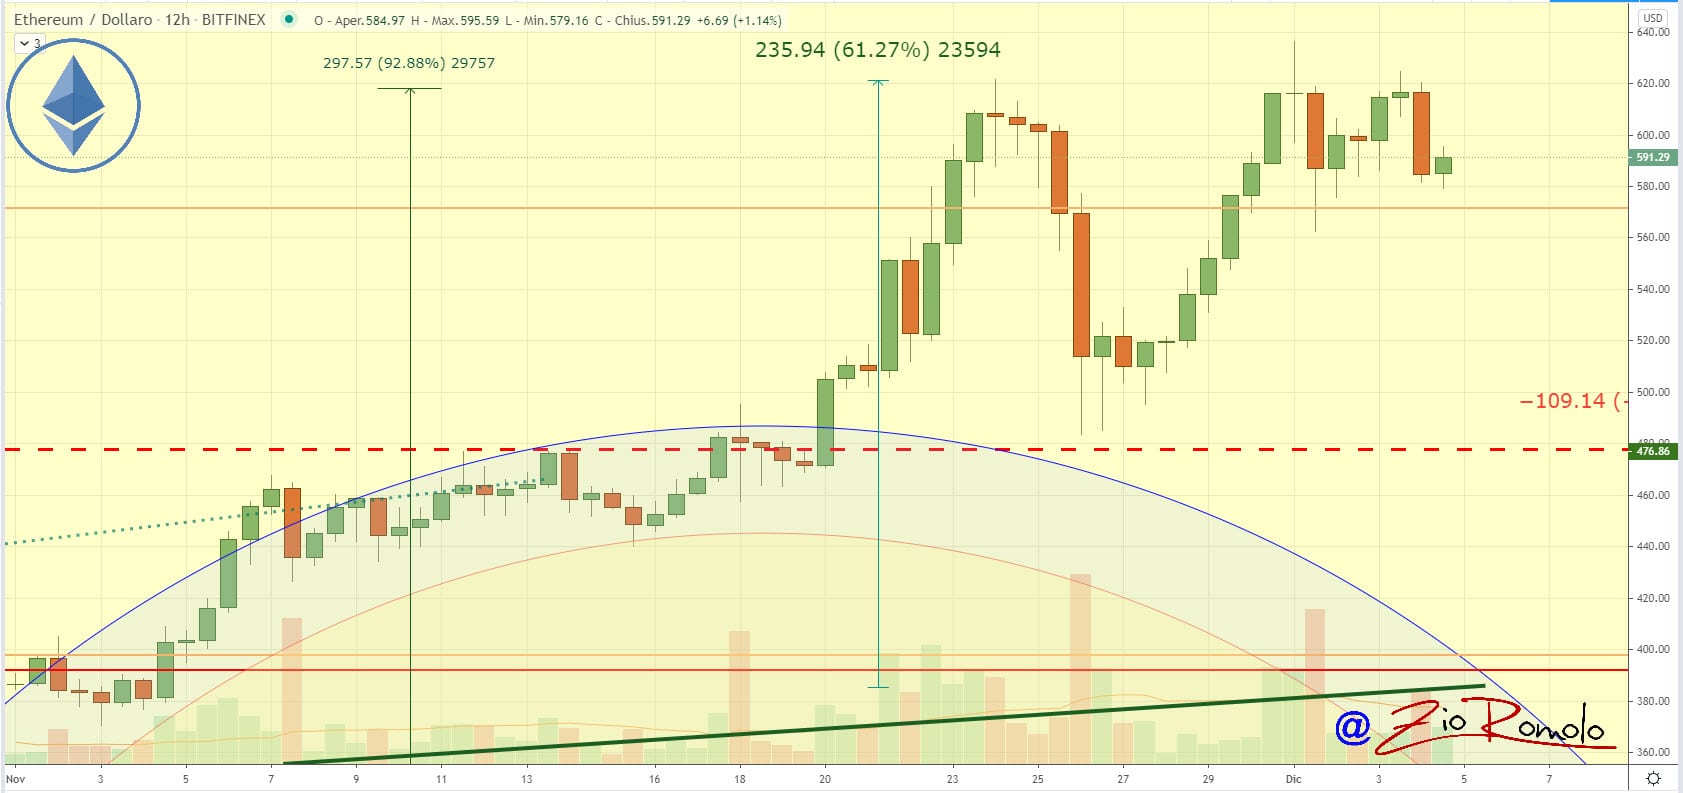
The bullish technical structure built since the lows at the beginning of November has left important technical references on the graph, which are also used by operators in options to protect positions in case of a trend reversal.
In the next few days, it will be important to find confirmations of the 500 USD, while in the short term it is important to invalidate the triple maximum of 620 USD that in the last 10 days has rejected bullish attacks.
In the case of a fall below a value of 500 USD, in fact, the technical signal would materialize opening spaces to revisit the bullish trendline that combines the lows of the last eight months and passes in the 400 USD area.


