Summary
Bitcoin Analysis
Bitcoin’s price again gave bullish market participants hope as it finished its daily candle on Wednesday +$493.
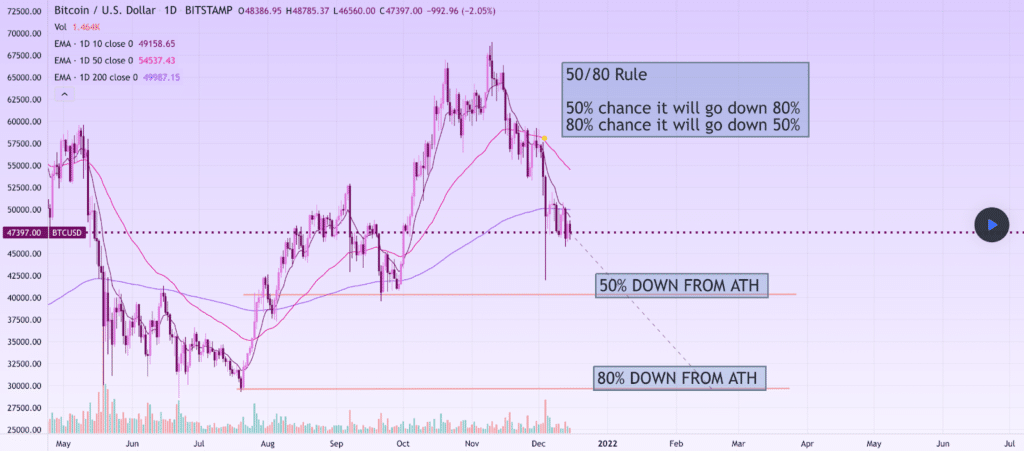
The BTC/USD 1D chart below from visioncrypto posits a bearish scenario for BTC’s price. The chartist uses the 50/80 rule on the chart below. He suggests with this model that there’s a 50% chance BTC’s price will go down 80% from its ATH to bring the price down to the $30k level. The 80% chance is that BTC goes down 50% from its ATH to touch and test the $40k level.

The bullish case for BTC is below on the 1W BTC/USD chart. If BTC’s price is able to hold the 61.8% fib level [$48,937] they’ll hope some bullish divergence emerges and they can again flip the 50% fib level [$52,234.28] from overhead resistance to support again.

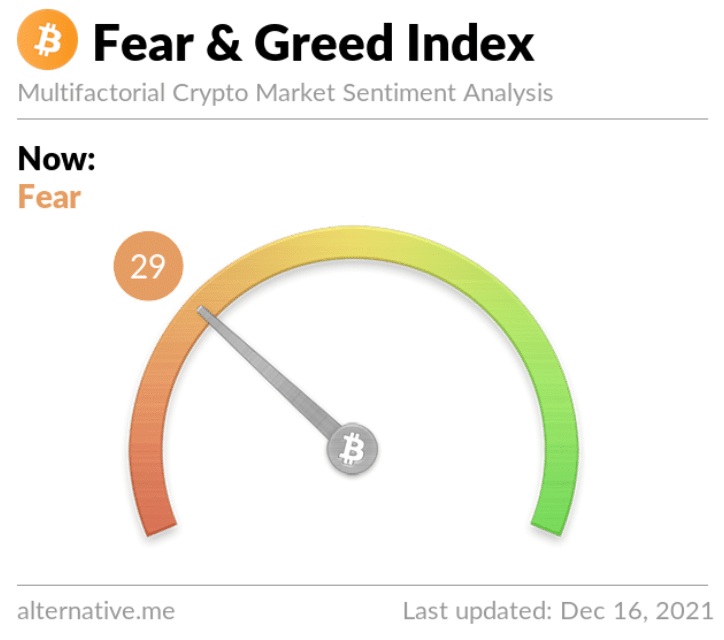
The Fear and Greed Index is 29 Fear and +1 from Wednesday’s reading of 28 Fear.

BTC’s 24 hour price range is $46,666-$49,257 and its 7 day price range is $46,580-$50,878. Bitcoin’s 52 week price range is $19,388-$69,044.
The price of bitcoin on this date last year was $21,317.
The average price of BTC for the last 30 days is $54,344.
Bitcoin [+1.02%] closed its daily candle worth $48,901 and in green figures for a second straight day.
Ethereum Analysis
Ether’s price also trended higher on Wednesday and rallied with the bulk of crypto assets finishing the day +$158.53.
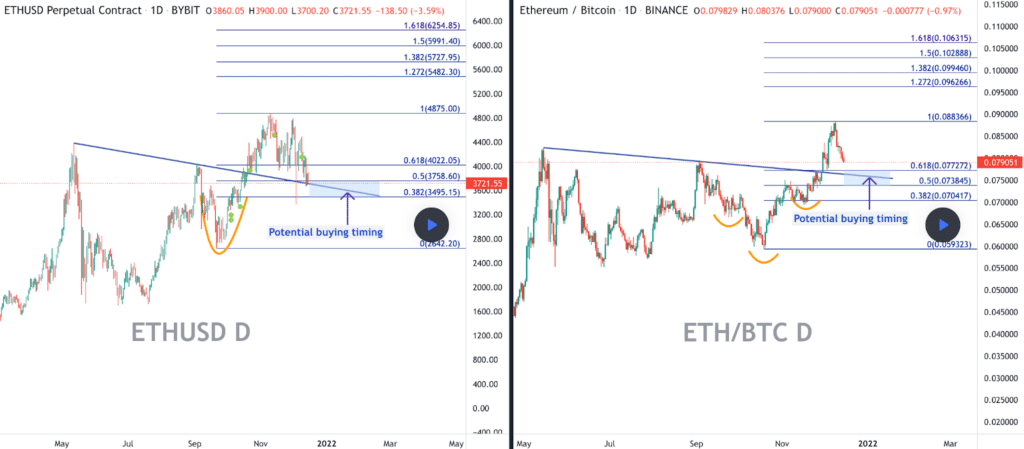
Today we’re looking at two different Ethereum charts from EthanTW. The one below and to the left is the ETH/USD 1D chart.
On this chart bullish Ether traders are holding .382 fib level [$3,495.15] and have reclaimed the .5 fib level [$3,758.6], at the time of writing. If bulls can hold that level and get some bullish divergence, bullish ETH traders will again set their sights on $4k, an important level of inflection. If they’re successful there, then bullish ETH traders will attempt to send ETH’s price up to test the .618 [$4,022.05] yet again.

The second chart on the right of the page is the ETH/BTC 1D chart and shows how strong ETH’s trend against BTC has been dating back to May. The chartist posits the 0.618 [.0777272] level could be a good entry for traders that believe ETH will continue to outperform BTC.
ETH’s 24 hour price range is $3,675-$3,965 and its 7 day price range is $3,702-$4,458. Ether’s 52 week price range is $575.67-$4,878.26.
The price of ETH on this date in 2020 was $635.96.
The average price of ETH for the last 30 days is $4,235.73.
Ether [+4.11%] closed its daily candle on Wednesday worth $4,018.94 and in green figures for a second straight daily candle close.
Elrond Analysis
Elrond’s price has been extremely volatile over the last few weeks. EGLD continued it’s extreme volatility with a major move to the upside on Wednesday and finished the day +$41.94.
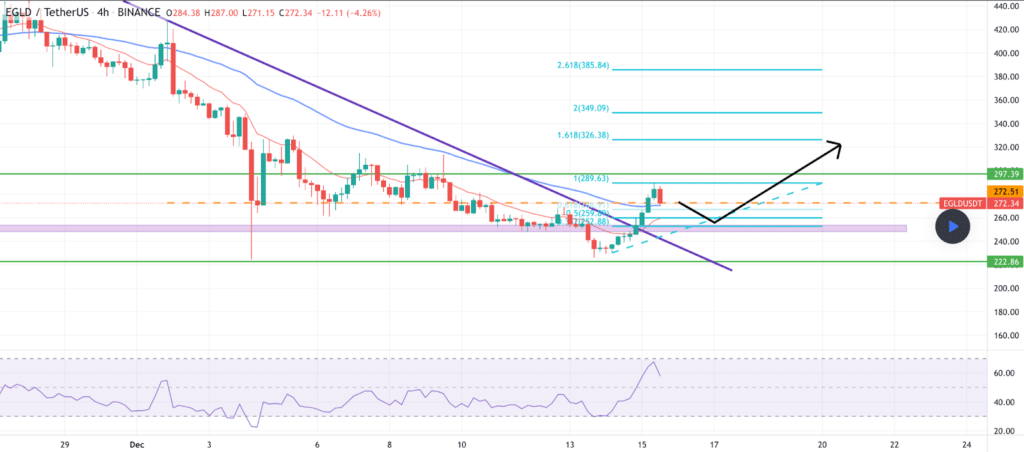
Elrond bulls thus far have been able to pivot and hold the .618 fib level [$266.91] as shown on the EGLD/USDT 4hr chart below from khashayar_taheri.

Elrond’s +1,102% against The U.S. Dollar over the last 12 months, +381.3% against BTC, and +77.77% against ETH over the same duration.
ELGD 24 hour price range is $247.21-$286.21 and its 7 day price range is $232.3-$308.65. Elrond’s 52 week price range is $20.85-$545.64.
Elrond’s price on this date last year was $21.79.
The average price for EGLD over the last 30 days is $344.25.
Elrond [+16.48%] closed its daily candle worth $296.37 on Wednesday and has finished in green digits for back to back days.


