Summary
Bitcoin Analysis
Bitcoin’s price finished its daily candle +$360 on Sunday and had an inflection point of $50k for the fourth consecutive daily close.
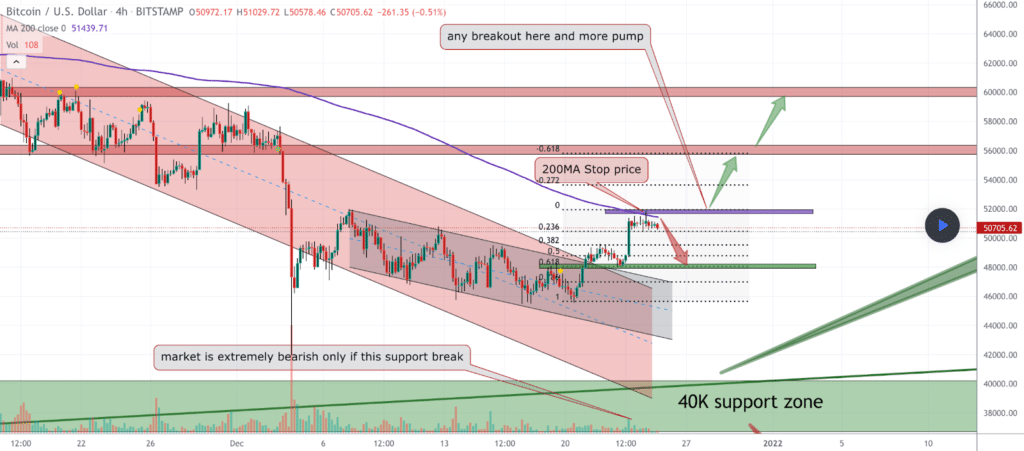
The BTC/USD 4HR chart below from MMBTtrader shows bitcoin holding on to the 0.382 fib level [$49,500].
Bullish BTC traders are looking overhead at the 0.236 fib level [$50,462] to break and leave behind again. A secondary target of bulls is the 0 fib or [$52k] level.

Bitcoin next targets
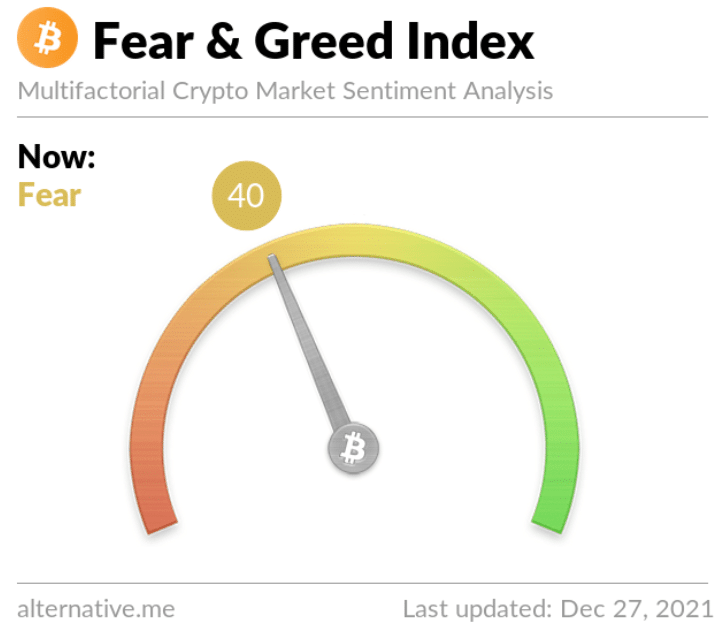
The Fear & Greed Index is 40 Fear and +3 from yesterday’s reading of 37 Fear.

BTC’s 24-hour price range is $49,687-$51,158 and its 7-day price range is $45,723-$51,792. Bitcoin’s 52-week price range is $25,923-$69,044.
The price of bitcoin on this date last year was $26,423.
The average price of BTC for the last 30 days is $50,687.
Bitcoin [+0.71%] closed its daily candle worth $50,797 and in green figures for 3 of the last four days.
Ethereum Analysis
Ether’s price closed Sunday’s daily candle -$31.52.
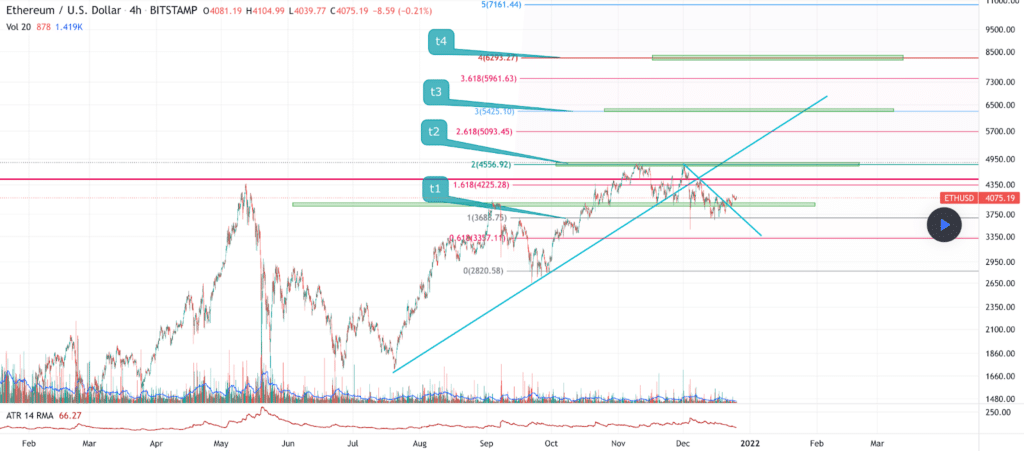
The ETH/USD 4HR chart below Arash_yakooza below shows primary targets overhead for Ether bulls. ETH bulls have a primary target of the 1.618 fib level [$4,225.28], a secondary target of the 2 [$4,556.92], and a third target of the 2.618 fib [$5,093].
If bullish Ether traders send ETH’s price over $5k and test the 2.618 fib level, Ether bulls will first have to break the asset’s current all-time high of $4,878.

Conversely, bearish Ether traders hope to hold off bulls and maintain ETH’s price below the 1.618 fib level. If bears manage to do so, in time, they’ll again try to send ETH’s price back down to the 1 fib level [$3,668.75]. Below the 1 fib level, a secondary target for bearish ETH traders is 0.618 [$3,357.11].
ETH’s 24-hour price range is $4,019-$4,139, and its 7-day price range is $3,776-$4,157. Ether’s 52-week price range is $636.37-$4,878.
The price of ETH on this date in 2020 was $689.66.
The average price of ETH for the last 30 days is $4,131.
Ether [-0.77%] closed its daily candle on Sunday, worth $4,061.17.
Near Protocol Analysis
Near Protocol’s price is +1,427% against The U.S. Dollar over the last 12 months, +682% against BTC, and +141.1% against ETH over the same duration, at the time of writing.
Bullish Near Protocol traders continued their momentum on Sunday for a sixth consecutive daily close in green figures.
The NEAR/USDT 1HR chart below from behzadjl shows overhead targets after NEAR’s price bounced off the ‘Buy-back Zone.’
The targets for bullish NEAR traders in the short term above are the 0.382 [$16.47], the 0.5 fib level [$17.39], and the 0.618 fib [$18.32].
All of the late momentum has belonged to bulls, so bearish NEAR traders need to send NEAR’s price back below the 0.236 fib [$15.33] and attempt to push NEAR’s price lower before an even larger thrust to the upside by bulls occurs.

Near Protocol’s 24-hour price range is $14.57-$15.93, and its 7-day price range is $8.35-$15.93. NEAR’s 52-week price range is $.99-$15.93.
Near Protocol’s price on this date last year was $1.20.
The average price for NEAR over the last 30 days is $9.7.
Near Protocol [+7.18%] closed its daily candle on Sunday worth $16.27.


