Summary
Bitcoin Analysis
Bitcoin’s price finished Wednesday’s daily candle back in green figures and +$1,124.
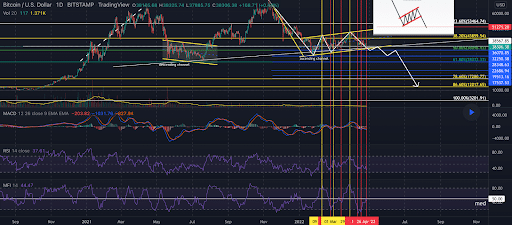
The BTC/USD 1D chart below from Ulyts shows BTC’s price trading between the 50.00% fibonacci level [$36,096.43] and 38.20% fib level [$43,859.54], at the time of writing.
The targets to the upside for bullish BTC traders are 38.20%, and 23.60% [$53,464.74. Conversely, the targets to the downside for bearish BTC market participants are 50.00%, 61.80% [$28,333.33], and 78.60% [$17,80.77].


BTC’s 24 hour price range is $38,370-$38,551 and its 7 day price range is $38,111-$42,736. Bitcoin’s 52 week price range is $29,341-$69,044.
The price of bitcoin on this date last year was $54,991.
The average price of BTC for the last 30 days is $42,512.
Bitcoin’s price [+2.95%] closed its daily candle worth $39,263 on Wednesday and has closed in green figures for three of the last four days.
Ethereum Analysis
Ether’s price also finished in green figures by greater than 2% on Wednesday and concluded its daily session +$78.60.
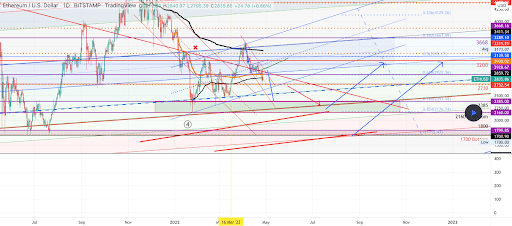
The second chart we’re analyzing today is the ETH/USD 1D chart below by xtremerider8. Ether’s price is trading between the 0.786 fibonacci level [$2,391.58] and 0.618 [$2,922.36], at the time of writing.
Optimistic Ether traders are targeting 0.618 followed by 0.50 [$3,295.17], 0.382 [$3,667.99] and 0.236 [$4,129.26].
From the bearish perspective, bearish Ether traders are looking at the 0.786, 0.854 [$2,176.74] and1 [$1,715.47].

ETH’s 24 hour price range is $2,833-$2,909 and its 7 day price range is $2,811-$3,167. Ether’s 52 week price range is $1,719-$4,878.
The price of ETH on this date in 2021 was $2,647.
The average price of ETH for the last 30 days is $3,158.58.
Ether’s price [2.80%] closed its daily candle on Wednesday worth $2,888.94.
Apecoin Analysis
ApeCoin’s price had the best close of the lot for Wednesday’s analyses and APE finished its daily session up more than 7% and +$1.36.
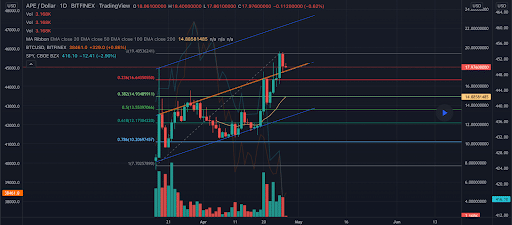
The third chart we’re analyzing today is the APE/USD 1D chart below from pvnkb1tch. ApeCoin’s price is trading between the 0.236 [$16.64] and 1 [$19.40], at the time of writing.
While the bulk of cryptocurrency assets are down 50% or more from their all-time high, Ape’s price has diverged from the macro cryptocurrency market price action over the last month and made a new all-time high of $19.94 on Wednesday.

ApeCoin’s price is +28.21% against The U.S. Dollar for the last 30 days, +54.71% against BTC, and +47.98% against ETH over the same duration, at the time of writing.
ApeCoin’s 24 hour price range is $18.01-$19.94 and its 7 day price range is $13.89-$19.94. APE’s 52 week price range is $6.41-$19.46.
ApeCoin’s price [+7.52%] closed its Wednesday’s daily session worth $19.43.


