Bitcoin Analysis
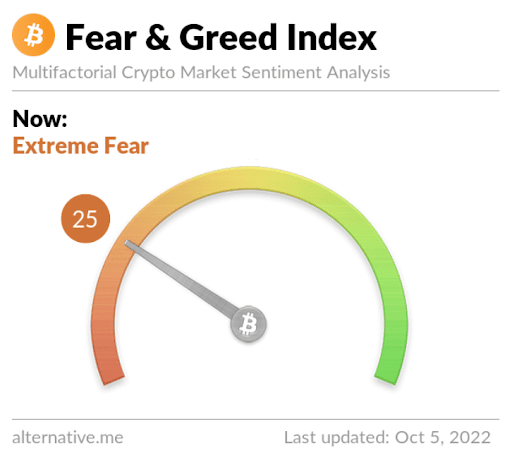
Bitcoin bulls again regained $19,891 on Tuesday which is arguably now the most critical level of inflection in bitcoin’s history. After the day’s candle had been printed, BTC’s price was +$711.3.
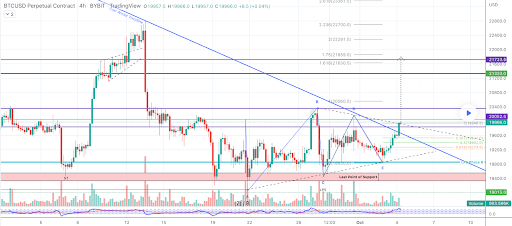
The first chart we’re analyzing for this Wednesday is the BTC/USD 4HR chart below by zippy1day. BTC’s price is trading between the 0 fibonacci level [$19,946.5] and 1 fib level [$20,560.5], at the time of writing.
The targets above for bullish BTC traders are the 1 fib level followed by 1.618 [$21,630.5], 1.75 [$21,859.0], 2 [$22,291.5], 2.236 [$22,700.0], and 2.618 [$23,361.5].
Conversely, the traders that are anticipating further downside yet have to push BTC’s price below the 0 fib level with targets after that level of 0.382 [$19,531.0], 0.5 [$19,402.5], and 0.618 [$19,274.5].
Bitcoin’s Moving Averages: 5-Day [$19,640.18], 20-Day [$19,708.95], 50-Day [$21,225.25], 100-Day [$22,744.05], 200-Day [$31,642.65], Year to Date [$31,409.67].
BTC’s 24 hour price range is $19,490.6-$20,475 and its 7 day price range is $18,548.96-$20,475. Bitcoin’s 52 week price range is $17,611-$69,044.
The price of Bitcoin on this date last year was $51,508.
The average price of BTC for the last 30 days is $19,750.6 and its +0.7% over the same stretch.
Bitcoin’s price [+3.62%] closed its daily candle worth $20,340 and in green figures on Tuesday for a second day in a row.
Summary
Ethereum Analysis
Ether’s price also has been dominated by bullish market participants over the last few days and when Tuesday’s trading session concluded, ETH’s price was +$38.1.
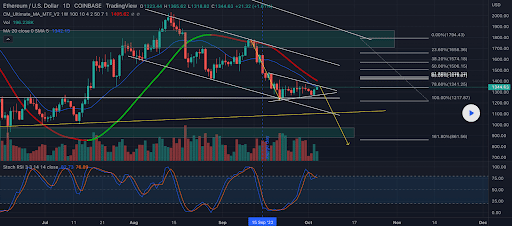
We shift to the ETH/USD 1HR chart below from EdgarTigranyan for our second price analysis today. Ether’s price is trading between the 78.60% fib level [$1,341.25] and 65.00% fib level [$1,419.67], at the time of writing.
Bullish Ether traders are on the verge of regaining the $1,400 level which is a major level of inflection dating back to ETH’s 2018 ATH. If bulls can regain that level their targets shift to 65.00%, 61.80% [$1,438.12], 50.00% [$1,506.15], 38.20% [$1,574.18], 23.60% [$1,658.36], and 0.00% [$1,794.43].
Bearish ETH traders have a different route in mind, they want to first stop the reversal bulls are putting in currently and then send ETH downward to test the 78.60%, 100.00% [$1,217.87], and 161.80% [$861.56].
ETH’s 24 hour price range is $1,318.66-$1,369.55 and its 7 day price range is $1,270.59-$1,369.55. Ether’s 52 week price range is $883.62-$4,878.
The price of ETH on this date in 2021 was $3,517.82.
The average price of ETH for the last 30 days is $1,456.69 and its -14.41% over the same time frame.
Ether’s price [+2.88%] closed its daily candle on Tuesday worth $1,361.5 and ETH’s finished in green digits for two consecutive days.
Elrond Analysis
Elrond’s price was up more than 10% at times during Tuesday’s trading session and when traders settled-up at 12:00 UTC, EGLD’s price was +$3.19.
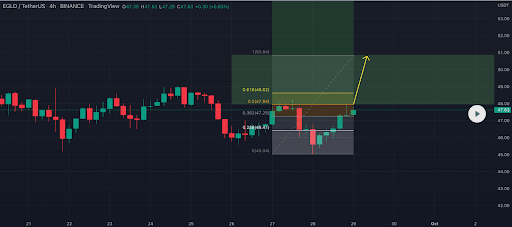
The EGLD/USD 4HR chart from serh_ukraine is the final chart for analysis this Wednesday.
Bullish EGLD traders sent Elrond’s price parabolic on the 4HR timescale on Tuesday. They first regained the 0.382 fib level [$47.25] followed by the 0.5 [$47.94], 0.618 [$48.62] and then the 1 fib level [$50.84].
The targets are in reverse now for bearish traders that gave up a lot of ground on Tuesday – their eventual target is the 0 fib level [$45.04] that’s proven to be a strong support recently for bullish Elrond market participants.
Elrond’s Moving Averages: 5-Day [$50.02], 20-Day [$49.33], 50-Day [$54.06], 100-Day [$58.41], Year to Date [$83.88].
Elrond’s price is +7.87% against The U.S. Dollar over the last 30 days, +6.81% against BTC, and +24.95% against ETH, over the same duration.
EGLD’s 24 hour price range is $51.6-$56.87 and its 7 day price range is $45.19-$56.87. Elrond’s 52 week price range is $38.07-$542.7.
Elrond’s price on this date last year was $245.15.
The average price of EGLD over the last 30 days is $49.51 and its +6.78% over the same period.
Elrond’s price [+6.13%] closed its trading session on Tuesday worth $55.21 and in green figures again for the fourth straight day.


