The current day in the crypto market is quite slow and with low volumes, which stay below the average. The sum of the trades of the last two days reveals the lowest trading period of the last two months. It is necessary to return to mid-June to find these volumes.
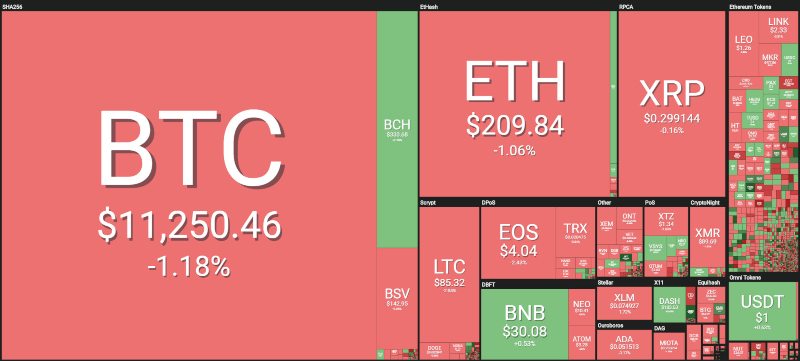
Compared to yesterday, today’s day sees an increase in the prevalence of red signs, although with decreases that are not worrying. Among the first 20 cryptocurrencies, it is possible to see declines between 1 and 3%. Among these, the worst is Cardano (ADA) which loses 3.7% of its value compared to the last 24 hours.
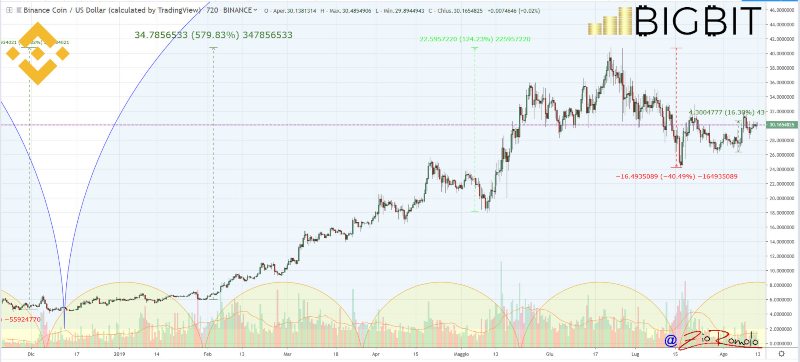
Among the top 50 there is only one green sign and it is that of Binance Coin (BNB), which shows a rise of around 5%, followed at a distance by Bitcoin Cash with a +1% coupled with a trend that leads BCH to consolidate the 4th position in the ranking after having overtaken Litecoin (LTC).
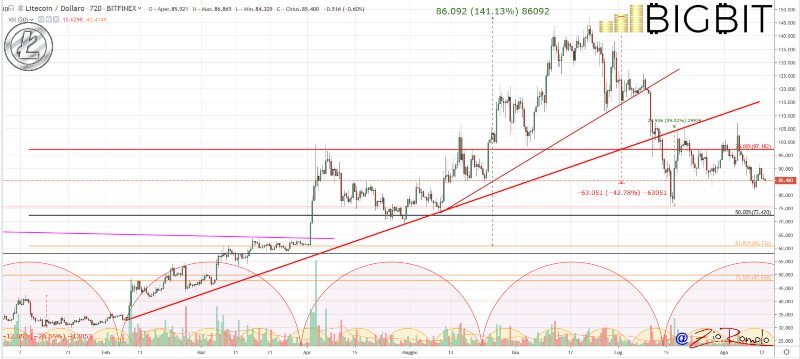
Litecoin continues to suffer the bearish trend and in these last hours, it returns to face the short-term battle between Bears and Bulls, losing about 1% and establishing its value around 85 dollars. A drop that shows a 40% difference from the maximums recorded before the halving with the peaks reached at the end of June.
Among the notable increases of the day, Japan Content Token (JCT) returns to be noticed, highlighting the high volatility with a double-digit increase: +11%. ABBC Coin (ABBC) rose by 20% and reached 65th position with 100 million of capitalisation at present, followed by Clipper Coin (CCCX) which rose almost 20%, 92nd position and 55 million of capitalisation.
The worst of today are Maximine Coin (MXM) and VestChain (VEST), both down about 13%.
The sector is not affected by the news of the postponement of three bitcoin ETFs by the SEC. After what has happened in recent months, the high volatility of bitcoin has probably led the SEC to postpone the approval of these ETFs. All postponed until late September and mid-October. At this time, investors seem to be ignoring this issue. In the last few days they have been focusing on the macroeconomic tensions between China and the United States, and on the demonstrations and protests that have been taking place in Hong Kong in recent hours, which could lead to a shift in value through non-traditional channels controlled by the Chinese government. Attention could also be drawn in these hours to the sharp fall in the value of the Argentine Peso after the recent presidential elections that have devalued the currency in a matter of hours.
The general market cap remains below 300 billion dollars, with very low volumes. Bitcoin trades half of the entire amount of volumes in the crypto market. The dominance of the bitcoin remains hooked to 69% despite the price showing a slight decline (-1%). Dominance is practically unchanged also for Ethereum, which rises to 7.6% while Ripple continues to fluctuate just below the threshold of 4.3%.
Bitcoin (BTC)
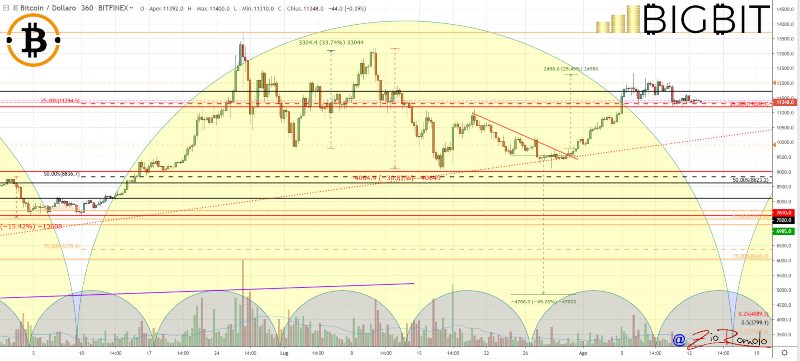
Bitcoin continues to exhibit fatigue, as shown by the lack of willingness to return testing the $12,000 area. A condition that if it were to last in the next few hours, would increase the possibility of a short-term return of bears and the testing of the $10,800 area.
A possible sinking under this level would increase the chances of going to test the dynamic trendline that is passing right now in the $10,250-10,200 area. Movements above this level would not affect the bullish trend which has been present since April.
Ethereum (ETH)
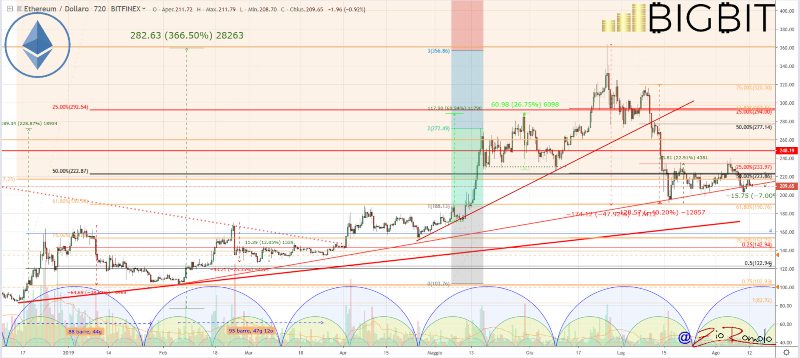
The supply and demand battle over the dynamic trendline that has been in place since February has moved into the $205 area. This is the level to be followed with particular attention in the coming hours.
A rupture of the psychological threshold of 200 dollars would project prices very likely and easily to 190 dollars and then open up spaces down to the $150-155 area, levels of support in the medium term from a monthly perspective.
There is particular room for manoeuvre in this period of low volumes but it is necessary to pay attention to what are the crucial levels in a long-term perspective.


