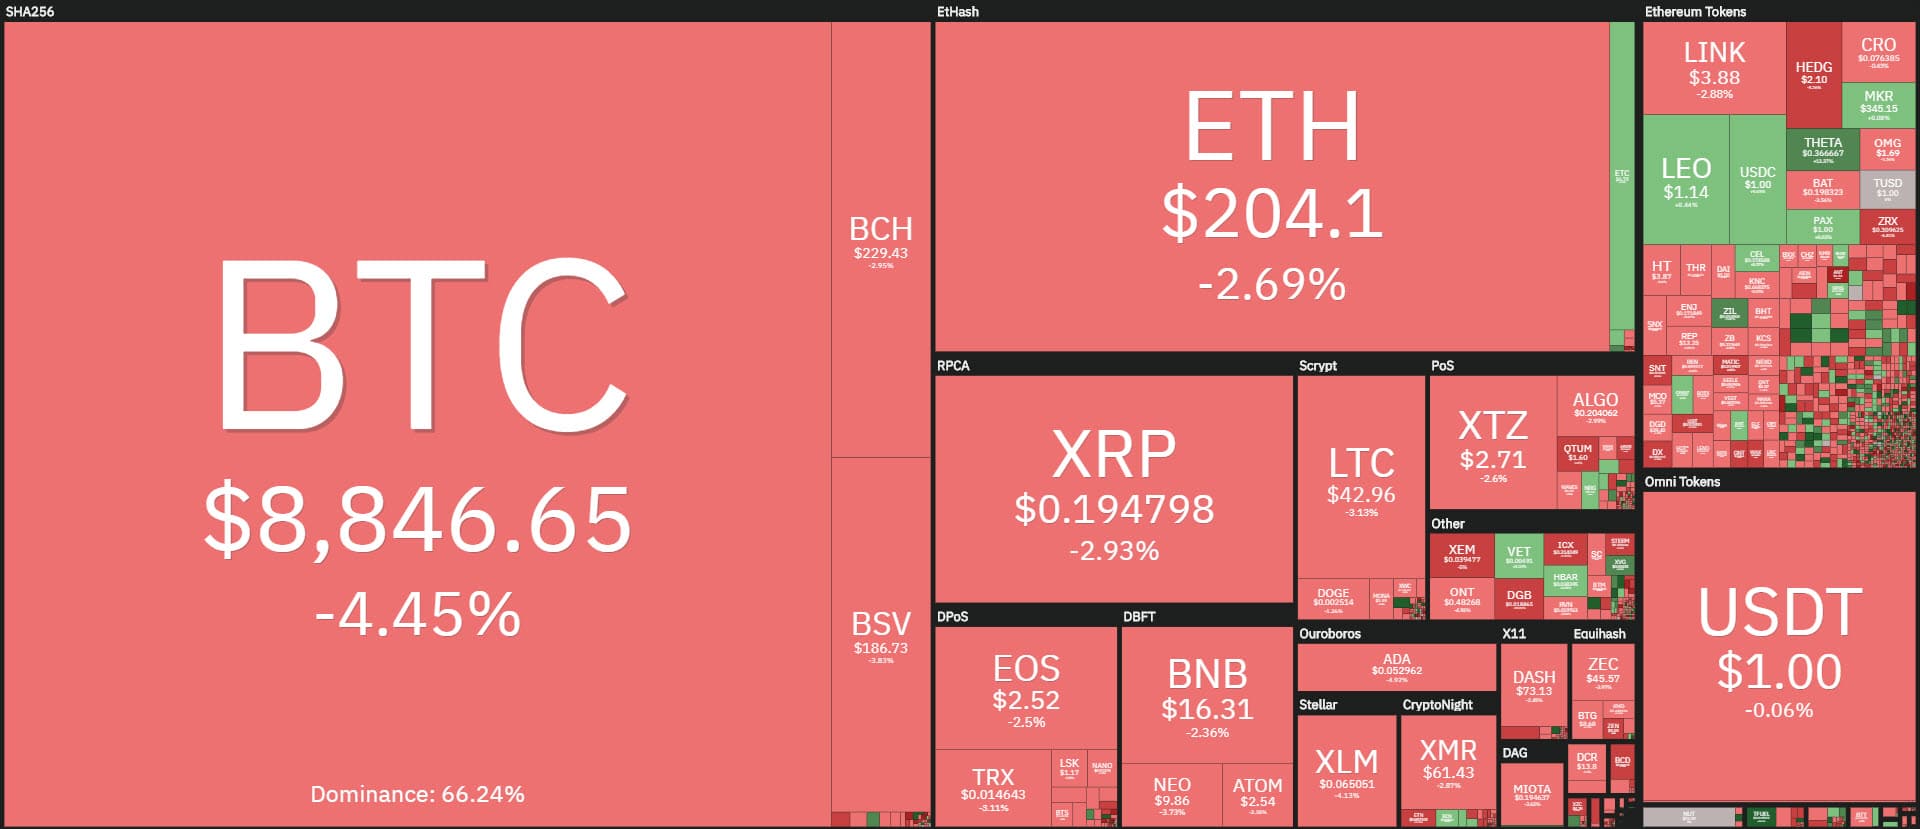
The negative closure of last week is also characterizing the beginning of the final week of May, which sees a clear prevalence of red signs. An exception to this is the price of the Theta crypto and Theta Fuel token, which are showing strong increases in value.

The third week of May closed with a loss of more than 10%, registering the deepest slide since the second week of March, the one that was characterized by the collapse that ended with period lows, reaching the lowest levels of the last year.
Today, among the first 100 capitalized, more than 85% are below par this morning. Declines that in the top 10 see falls of more than 4% for Bitcoin (BTC), Ethereum (ETH), Bitcoin Cash (BCH), Bitcoin Satoshi Vision (BSV) and Tezos (XTZ), all of which are the ones that have the biggest decreases on a daily basis.

The first green sign can be found by going down to 31st position where the Theta (THETA) crypto scores a high jump of over 9%, one of the best rises of the day.
Only the Theta Fuel (TF) token does better. Thanks to Theta’s agreements with eSport sports channels, these sports services will be installed on all Samsung Galaxy S20 phones and will reward streaming users with Theta Fuel tokens. It is estimated that over 75 million devices will have Theta TV installed.
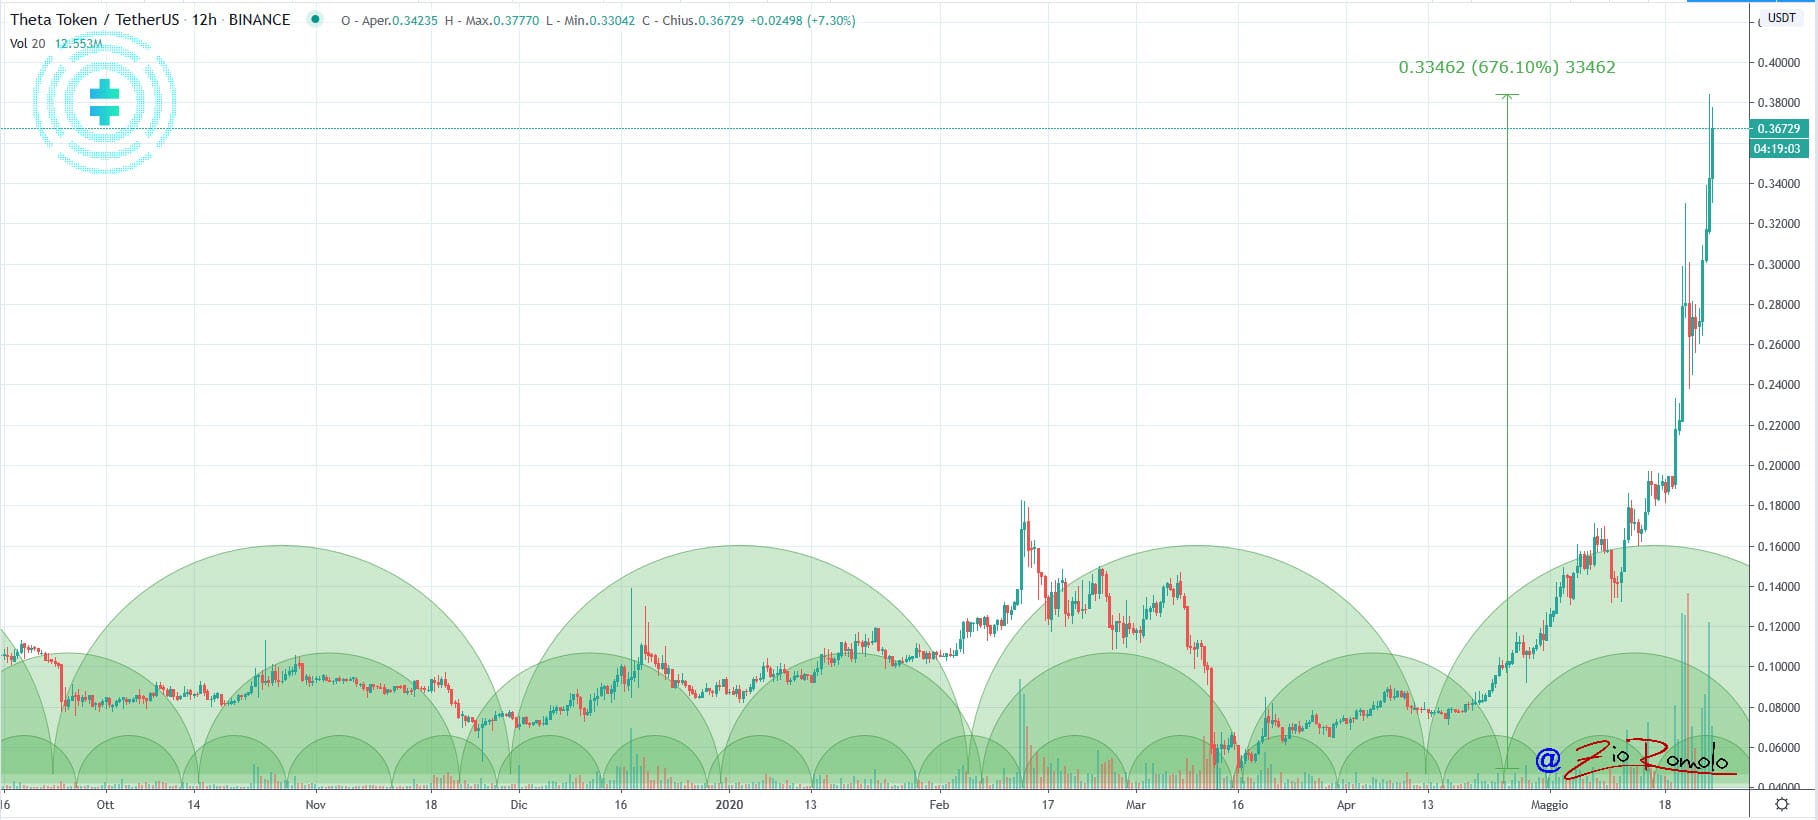
This brings the Theta Fuel token up by 60%, and the Theta token up by 9%. Added to the ups of the past few days, Theta is more than 85% higher than last Monday’s levels and from the lows of March 13th, it represents a 670% rise.
From 0.035, Theta now climbs to $0.38 and multiplies by 7 times the value, updating the absolute all-time highs for the token, which is ranked 31st in the ranking of the major capitalized, with over $300 million.
Among the day’s rises are Zilliqa (ZIL) and Verge (XVG) at +4% and Hedera Hashgraph (HBAR) which gains 1.5%.
Among the worst declines, OmiseGo (OMG) opens the week with a drop of 8%. OmiseGo has been performing well this past week. Now, the profit-taking prevails. On a weekly basis, despite today’s decline, it gains 80% from last Monday’s levels.
Capitalization is back below $250 billion, a loss conditioned by the decline of the last week of Bitcoin, which after nearly $180 billion in the past few days, falls with the decline of the last few days, losing about $20 billion and affecting the total market cap.
As for the capitalization of the altcoins, it is 3 billion dollars lower than last week’s levels, remaining at the same levels of the last 15 days, not suffering a particular setback. This indicates that altcoins have been particularly overperforming in the last few days compared to Bitcoin, which instead is giving market share to altcoins and small caps.
The dominance of Bitcoin in fact recedes to 65.5%, losing two percentage points from last week’s levels. Despite the price drops, Ethereum and Ripple gain dominance: Ethereum returns above 9% while Ripple returns to 3.5%.
The fear and greed index returns above 40 points despite failing the recovery of the highest point at 56, recorded last mid-February.

Bitcoin (BTC)
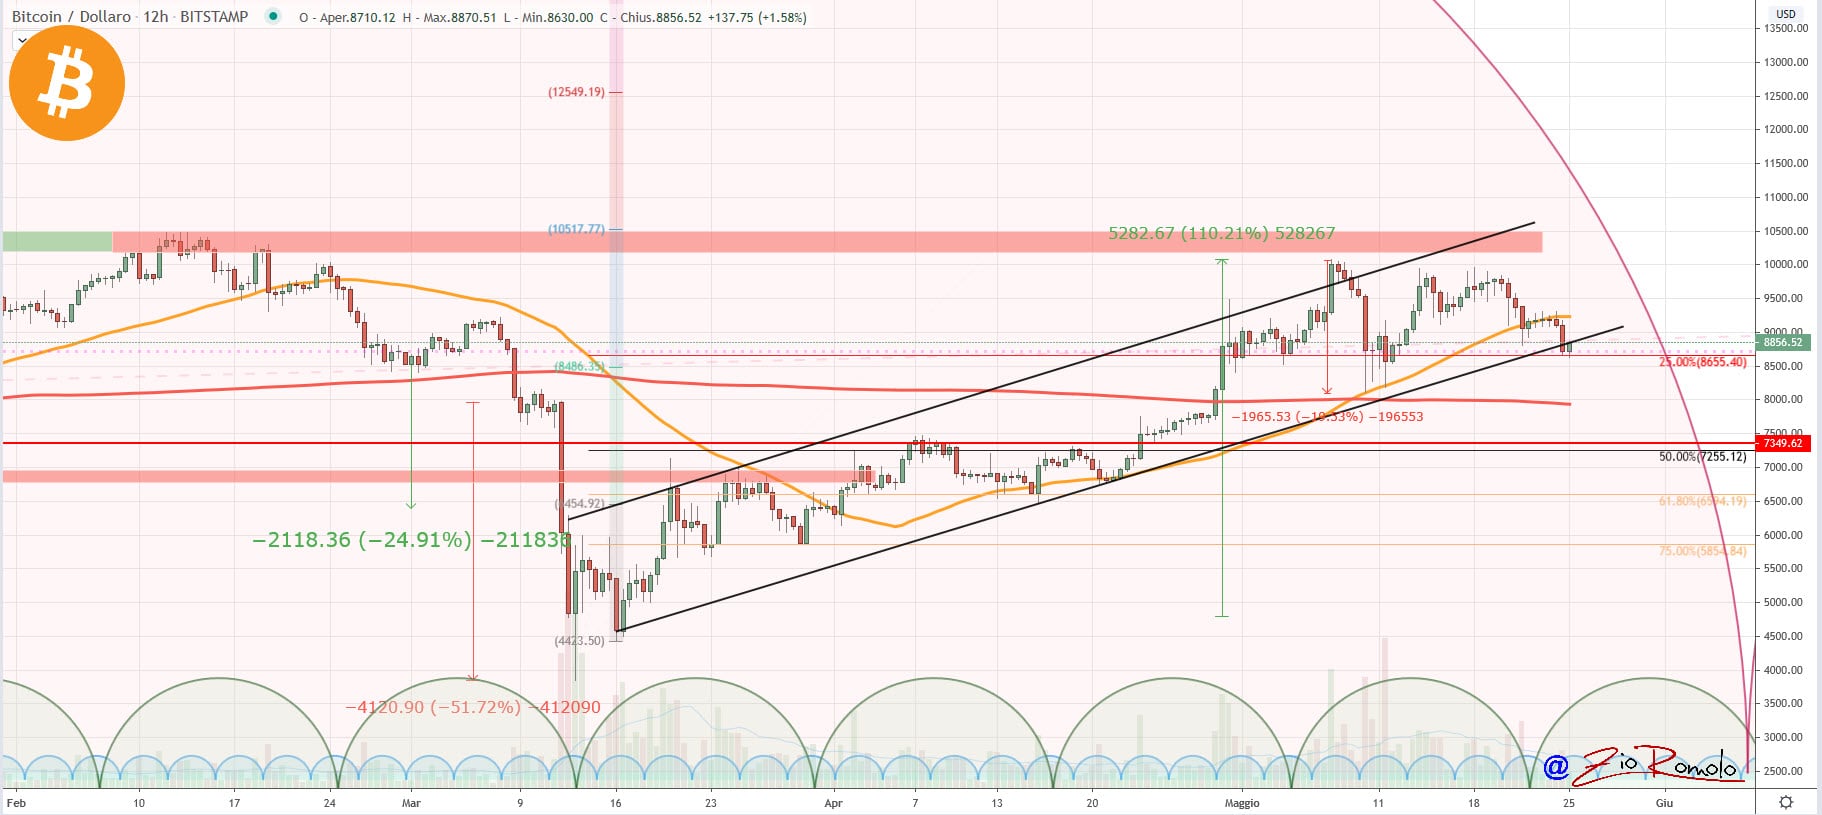
Bitcoin’s loss of value is more than 13% from its top levels at the beginning of May, when prices for the first time in more than three months crossed the $10,000 threshold.
Bitcoin’s price is now back down to $8,600. This is not a real collapse for Bitcoin as this fall at the moment indicates that prices are at a standstill at 25% of the Fibonacci retracement which takes as its reference the mid-March lows and early May highs.
After the break of the short-term bullish trendline that occurred last Thursday, prices are going to test the lower neckline of the bullish channel that has been accompanying the Bitcoin uptrend since last mid-May.
It is necessary for Bitcoin in the coming hours to consolidate prices above the $8,000 threshold and not to fall below $8,100, the lows recorded a few hours before the third halving that occurred two weeks ago.
Only a fall below these two levels could trigger further sales and declines. A positive sign, however, would come with the regain of $9,300 in the coming days that would bring back confidence and attract new purchases.

Ethereum (ETH)
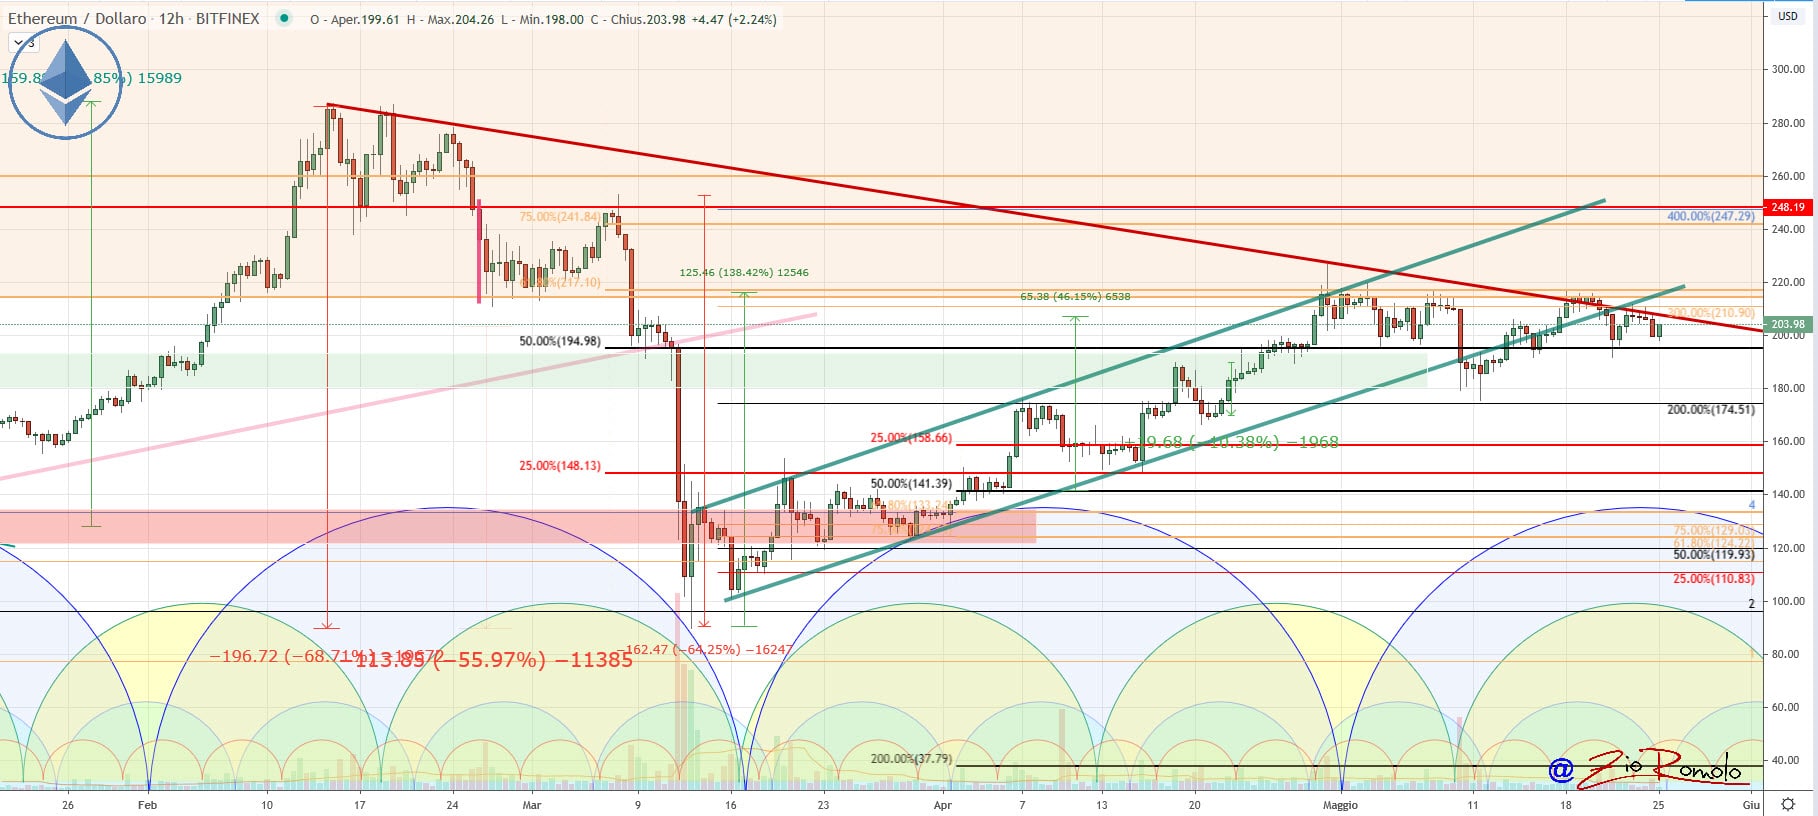
Ethereum fails to confirm the recovery within the bullish channel and with prices at $200, a more psychological than a technical threshold, indicates the failure of this recovery and a trend that currently becomes a lateral bearish trend in the medium term.
For ETH, it is necessary not to go below the technical support threshold of 190 dollars to limit the weakness that has been characterizing Ethereum for about 2 weeks. A positive signal would come with the recovery of the 315 dollars, relative highs recorded last week, where the defence of the Bears was triggered, rejecting the rise.


