


Today the crypto that stands out is Ripple (XRP), whose price has not benefited from the bullish movement as intensely as other cryptocurrencies. Today, with a delayed outbreak, XRP is registering a price increase of 6-8% on a daily basis.
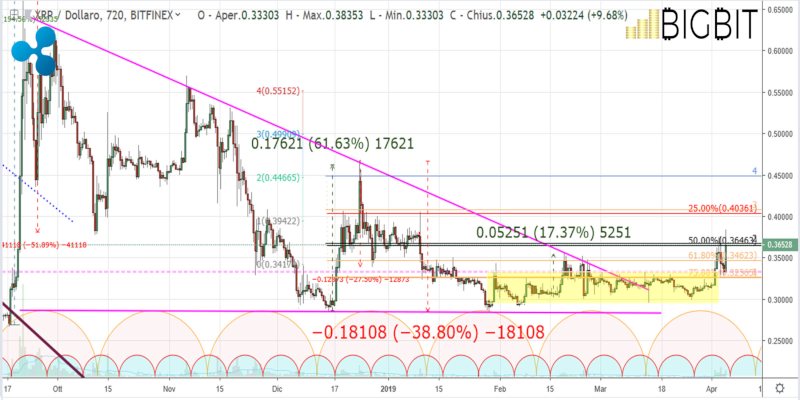
The Ripple Foundation has announced its participation in the xCurrent network, a protocol that is used by many financial institutions.
In recent hours, the participation of a German banking institution in xCurrent is bringing positivity and confidence to Ripple holders who are supporting the rise in the price of XRP.
A small retracement
Apart from Ripple, there are some red signals that are more of a ‘catching of breath’ after the strong rises of the last few days.
Most of the cryptocurrencies are catching their breath, like bitcoin, which has retraced from the $5,300 seen in recent hours in order to give a strong signal of consolidation around the $5,000 threshold.
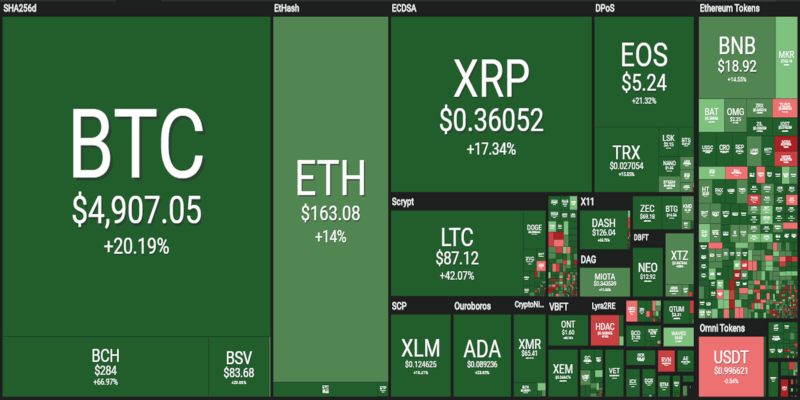
The week is about to close with obvious double-digit increases. Bitcoin exceeds 20% on a weekly basis, while Ethereum reaches almost 15%.
Capitalisation, after having almost touched 180 billion dollars, today stands at 172 billion. The volume mass is also decreasing, but it stops at values decidedly higher than the average trade of the last few weeks, with 70 billion dollars traded.
The dominance of bitcoin manages to remain over 50%. The recent rise has benefited Ripple, which is between 9 and 10%, after the bad slide of recent days that has seen its market share go below 9%. Whereas Ethereum is stable at 10%.
Bitcoin (BTC)
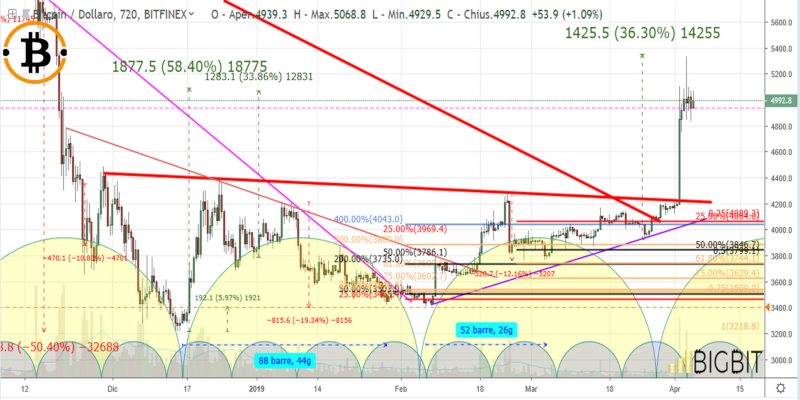
Bitcoin, after having risen above $5,300, the level where profit taking began, has seen its value return close to $4,800.
Those who boarded a train running between Tuesday and Wednesday are now suffering. When such strong impulses are recorded it is always good to let go of the lost train and not try to follow the movement started by stumbling into loss-making positions, despite the main trend continuing to stay upward.
The downturn accused in the last 12 hours sees prices testing the threshold of $4,800, the former resistance that has now become support. In these first moments of the day, prices return to 5,000 dollars, confirming that the level, as well as being psychological, tries to stand as an area of consolidation and this will be very important in the weekend and in particular in the coming days.
A holding of 4,800-5,000 dollars is an excellent bullish signal in a medium-term perspective and in view of next month. After an increase of more than 1,000 dollars, the consolidation of prices beyond medium-term levels is a signal that supports the bull and the entry of new purchases.
If the trend continues to be confirmed in the coming weeks, it will be necessary to review a price push to update the highs of the period, above $5,400, a medium and long term resistance. Downwards, it becomes important to hold the 4,500-4,300 dollar area. Any price return below this threshold is a negative signal.
Ethereum (ETH)
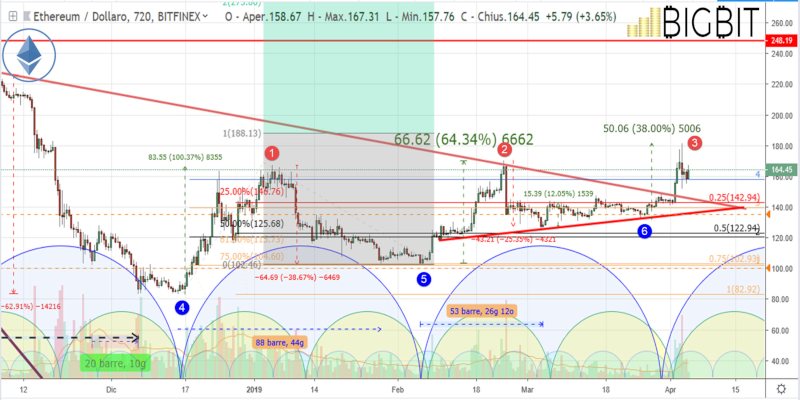
The signal of the breaking of the 165 dollars has projected Ethereum to update the maximums in the 170 dollars area, a level that was not recorded since last November.
In the last few hours, however, prices have returned back within the congestion, below 165 dollars, which had characterised the last three weeks. For Ethereum it is necessary to clarify over the weekend if it manages to exceed $165 again and settle beyond this level with the opening on Monday.
Oscillations below $165, within last week’s congestion, would create a false break from the previous double high (the highs recorded in early January and late February) by creating a triple low technical figure. That would be a worrying technical signal in the medium term.
For Ethereum it is necessary to confirm the threshold of 165 dollars and go beyond the threshold of 180 dollars in the next few days, or better still 185 dollars, a condition that would allow Ethereum to reach the area $200, a crucial level in the long term.
On the contrary, a downward movement below $135 would be a worrying technical signal for ETHs as the bullish movement has not been able to push prices beyond crucial resistance thresholds. The return below $135 would probably attract downward speculation even in the short and medium term.
