Summary
Bitcoin Analysis
Bitcoin’s price bearishly engulfed the daily timescale on Sunday and finished its daily candle -$1,721.
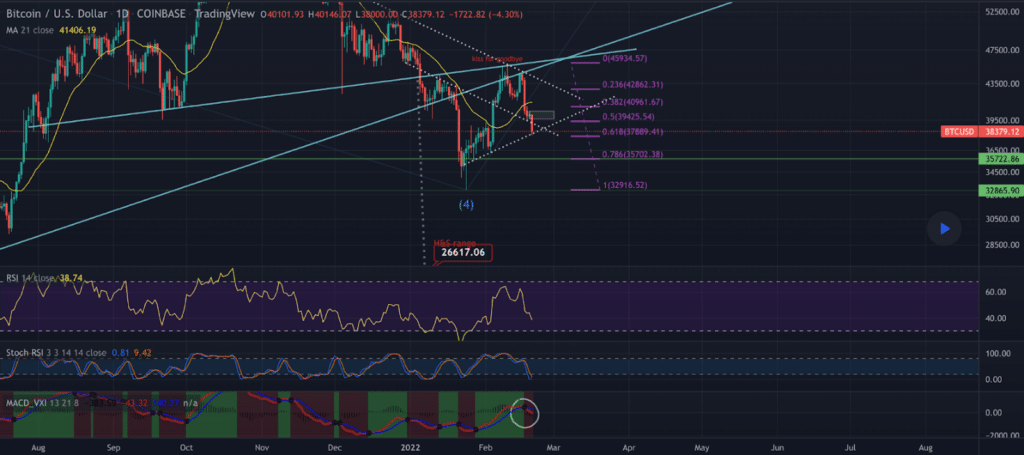
The first chart we’re analyzing today is the BTC/USD 1D chart below from NightTerm. BTC’s price lost the $40k level over the weekend and is ranging between the 0.5 fib level [$39,425.54] and 0.618 fib level [$37,889.41], at the time of writing.
Bullish BTC traders are hoping they can bounce off of 0.618 and again reclaim the 0.5 fib level with a secondary aim of 0.382 [$40,961.67].
From the bearish perspective, they’re looking to continue their momentum to the downside and crack the 0.618 fib with a secondary target of 0.786 [$35,702.38]. The third target for bearish bitcoin traders below is 1 [$32,916.52].

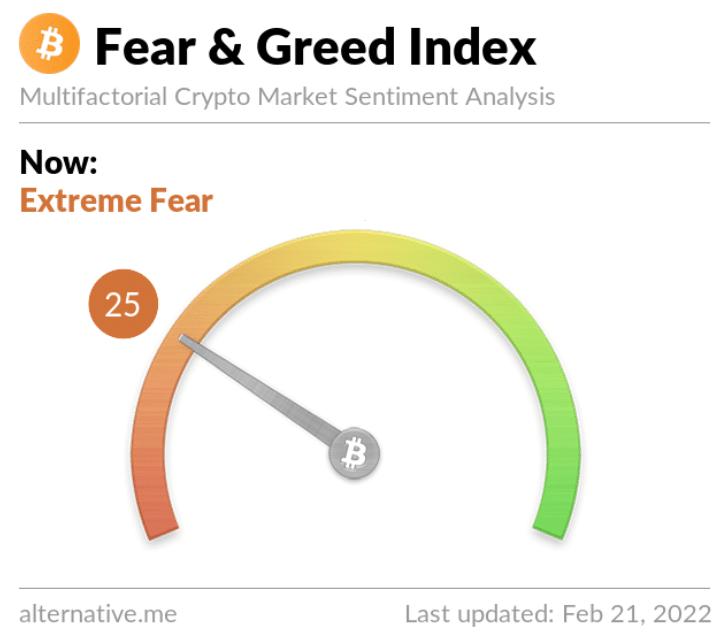
The Fear and Greed Index is 25 Extreme Fear and -2 from Sunday’s reading of 25 Fear.

Bitcoin’s Moving Averages: 20-Day [$40,282.14], 50-Day [$43,410.50], 100-Day [$50,966.22], 200-Day [$45,573.54], Year to Date [$41,281.38].
BTC’s 24 hour price range is $38,194-$40,164 and its 7 day price range is $38,194-$44,574. Bitcoin’s 52 week price range is $29,341-$69,044.
The price of bitcoin on this date last year was $57,669.
The average price of BTC for the last 30 days is $39,931.
Bitcoin’s price [-4.29%] closed its daily candle worth $38,420 and has finished in red figures for four of the last five days.
Ethereum Analysis
Ether’s price also bearishly engulfed on Sunday and finished its daily candle -$145.
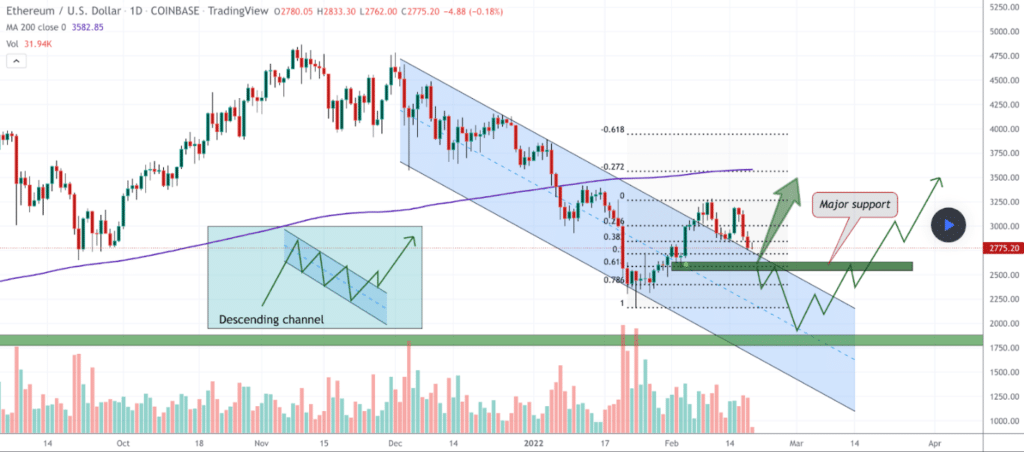
The ETH/USD 1D chart below from MMBTtrader shows ETH’s price retesting a breakout of its descending channel that it broke out of to the upside earlier this month.
Ether’s price is holding the 0.618 fib level [$2,589] and bulls are looking to reclaim the territory above 0.5 [$2,720].
Bearish Ether market participants conversely are aiming to send ETH’s price back down to retest the $1,800 level again. Before that price can be tested however, bearish Ether traders first need to send ETH’s price below 0.618 [$2,589], 0.786 [$2,400], 1 [$2,174].

Ether’s Moving Averages: 20-Day [$2,814.86], 50-Day [$3,285.09], 100-Day [$3,730.70], 200-Day [$3,224.62], Year to Date [$3,013.38].
ETH’s 24 hour price range is $2,593-$2,765 and its 7 day price range is $2,593-$3,179. Ether’s 52 week price range is $1,353-$4,878.
The price of ETH on this date in 2021 was $1,941.
The average price of ETH for the last 30 days is $2,786.
Ether’s price [-5.25%] closed its daily candle worth $2,618 and in red figures for the fifth straight day on Sunday.
Polygon Analysis
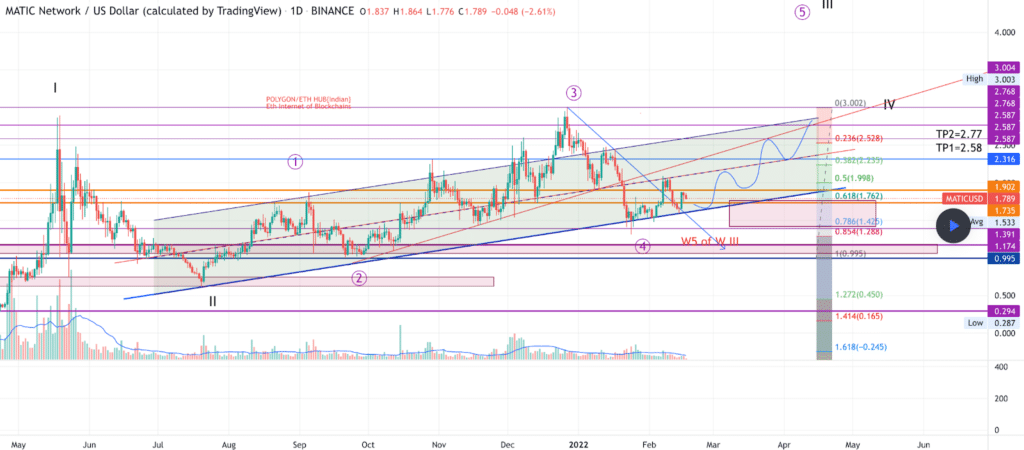
The last chart we’re examining today is the MATIC/USD 1D chart below from xtremerider8. MATIC’s price is bouncing between 0.786 [$1.42] and 0.618 [$1.76].
If MATIC bulls can reclaim the 0.618 fibonacci level their next target above is 0.5 [$1.99] with a secondary target of 0.382 [$2.23]. The third target to the upside for bullish MATIC market participants is 0.236 [$2.52].
Bearish MATIC traders are looking at 0.786 while seeking to snap that level and send MATIC to lower prices. The targets for bearish Polygon traders are 1 [$0.99], 1.272 [$0.45] and 1.414 [$0.165].

Polygon’s price is +807% against The U.S. Dollar for the last 12 months, +1,248% against BTC, and +581% against ETH over the same duration, at the time of writing.
MATIC’s 24 hour price range is $1.51-$1.63 and its 7 day price range is $1.51-$1.86. Polygon’s 52 week price range is $0.117-$2.92.
The price of MATIC on this date last year was $0.161.
The average price of MATIC over the last 30 days is $1.68.
Polygon’s price [-7.65%] closed Sunday’s daily candle valued at $1.5 and also bearishly engulfed the daily time frame.


