The last week of September is characterized by a collapse of the correlation between bitcoin and gold and by a closing in red, even if technically the recovery developed after the sinking on Wednesday, September 23rd is a good sign.
The movement draws a candlestick with a narrow body and a lower shadow that shows a solid rebound that finds confirmation also in these hours of the new week that will accompany us to the last quarter of the year, a period statistically considered double-sided.
In the last two years, it has been characterized by a perky start and a second half with a prevalence of profit-taking.
The collapse of the correlation between gold and bitcoin
Last week’s tensions had a general negative impact on all financial markets, from equities to commodities, with gold closing the eighth quarter with a 4.7% decline, the worst since mid-March.
The declines since early August, when gold rose above $2070 an ounce for the first time in history, are bringing down prices by more than 10% to today’s $1854 an ounce, contributing to the collapse of the daily correlation between Bitcoin and Gold to below 24% after setting the highest peak ever a few days ago – September 19th – by more than 76%. This figure highlights the good behaviour of Bitcoin despite the context of a particularly difficult month of September.
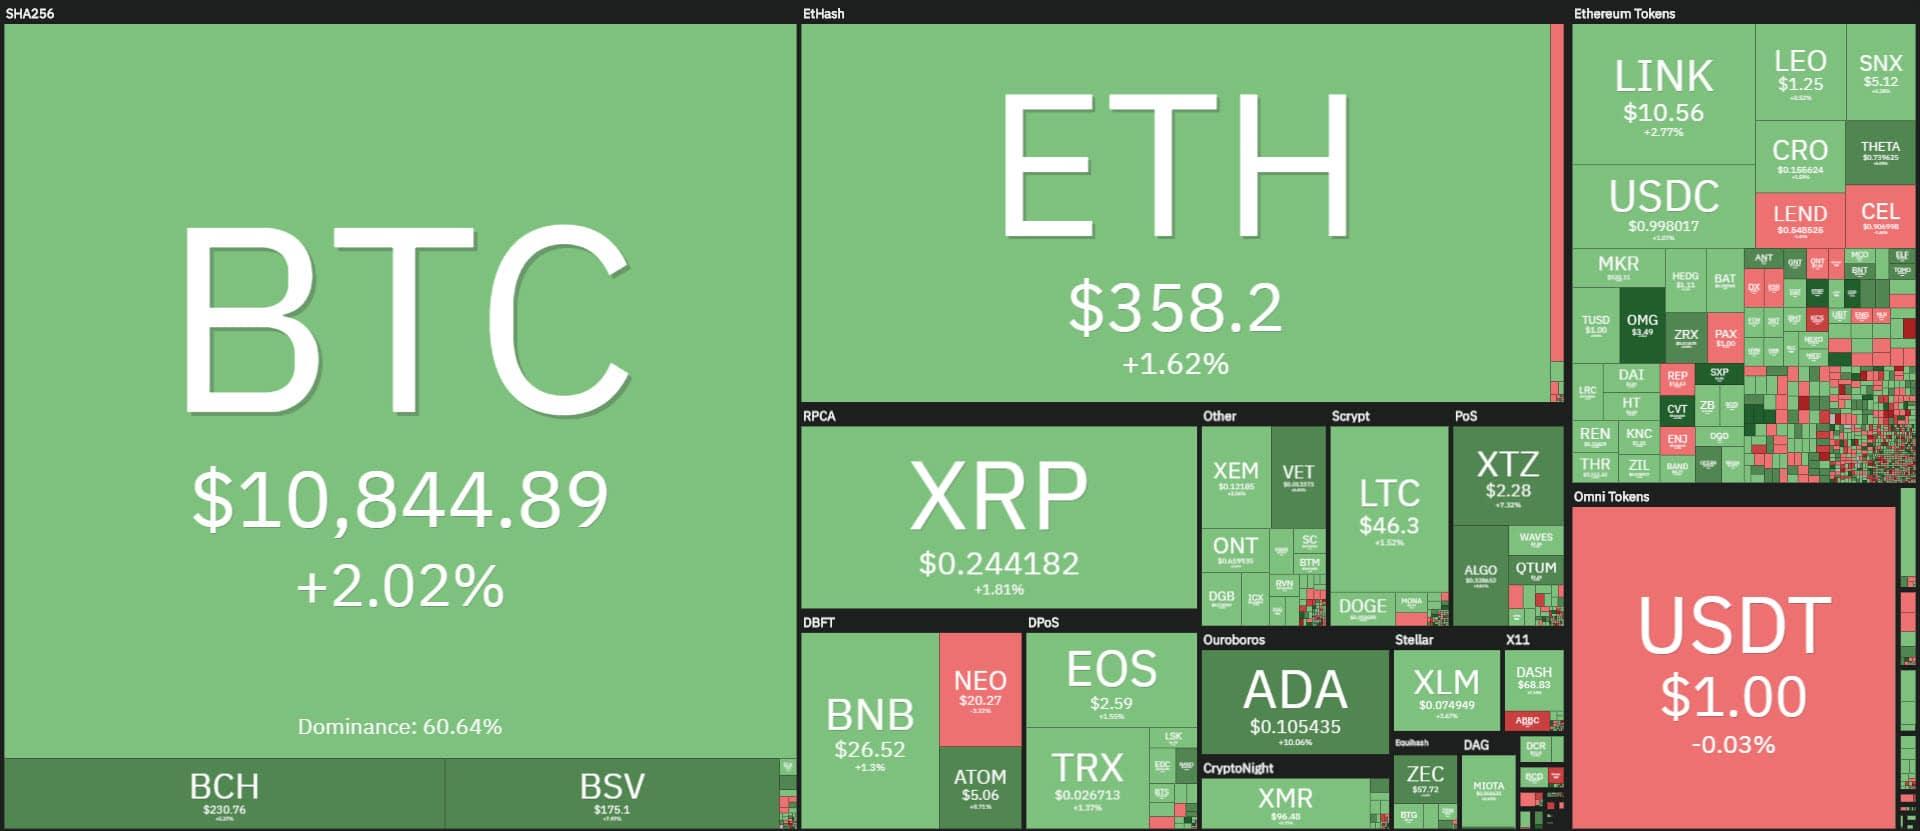
Crypto market in positive
The new week starts again with a prevalence of positive signs with more than 75% above parity.
Among the Top 15, there are only two signs in red: Binance Coin (BNB) and Polkadot (DOT) with lows of just over -0.2% for both.
Among the best are Bitcoin SV (BSV) and Cardano (ADA), up more than 8%, one of the best performances of the day.
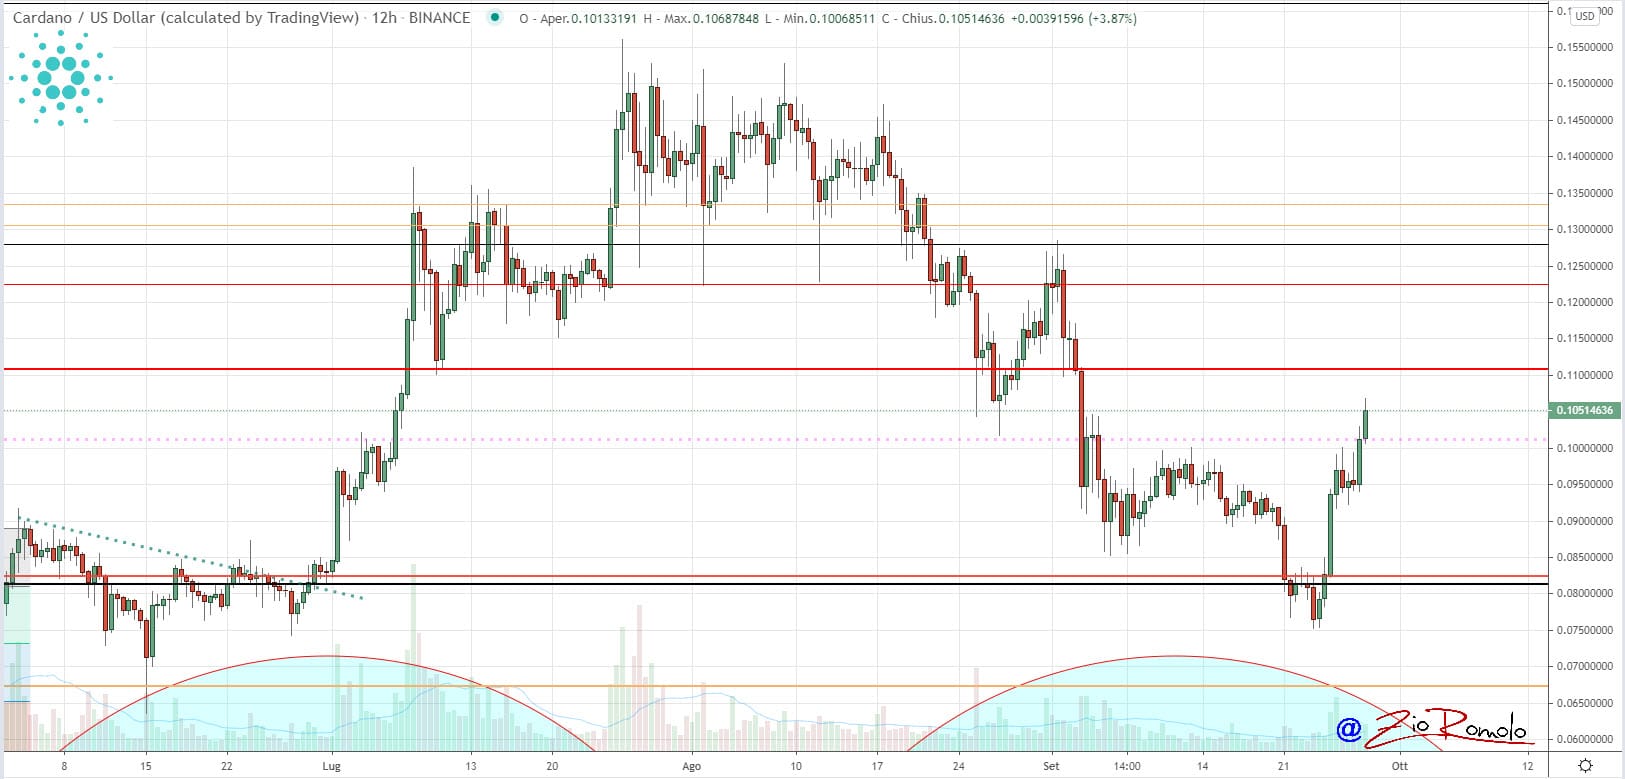
Widening the analysis among the top 100, only Arweave (AR) and Swipe (SXP) do better, both sprinting more than 30% from yesterday morning’s levels.

For Cardano, the market appreciates the return to trading on the Bittrex exchange after the blockage that lasted more than a month due to maintenance interventions following the Shelley protocol upgrade in early July.
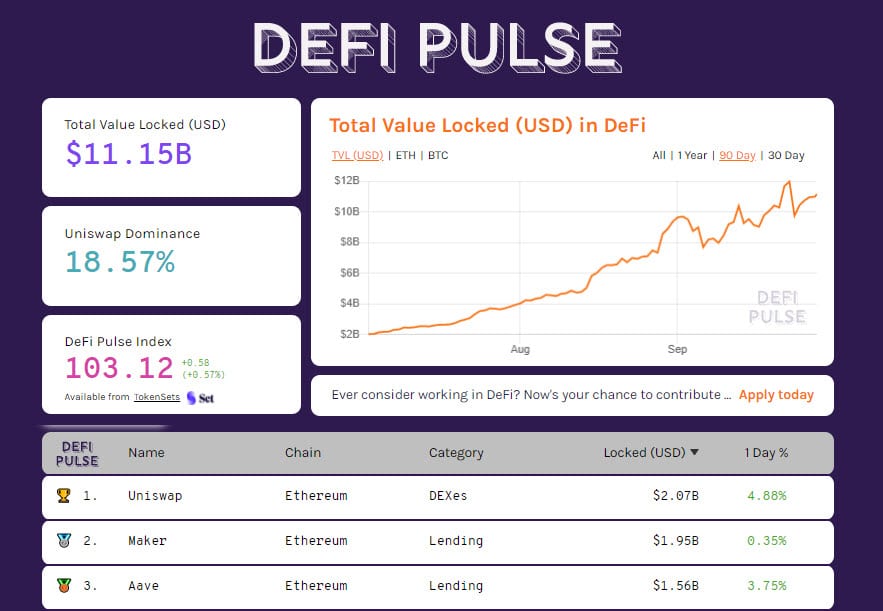
Another record for DeFi
New TVL on DeFi projects rose over $11 billion in the last few hours.
For the first time, a decentralized project has more than $2 billion locked on the Uniswap protocol, leader among decentralized exchanges (DEX). Maker’s lending protocol with over $1.95 billion in locked collateral follows closely. With over 130 thousand Bitcoin BTC tokenized for usage in decentralized finance.
An increasing number of Bitcoin owners prefer to take advantage of the hustle and bustle between decentralized projects to achieve better returns. Also benefiting from this is the Lightning Network’s Layer2 protocol which, with over 113,000 BTC, sets the record for capacity managed on bitcoin’s secondary network.
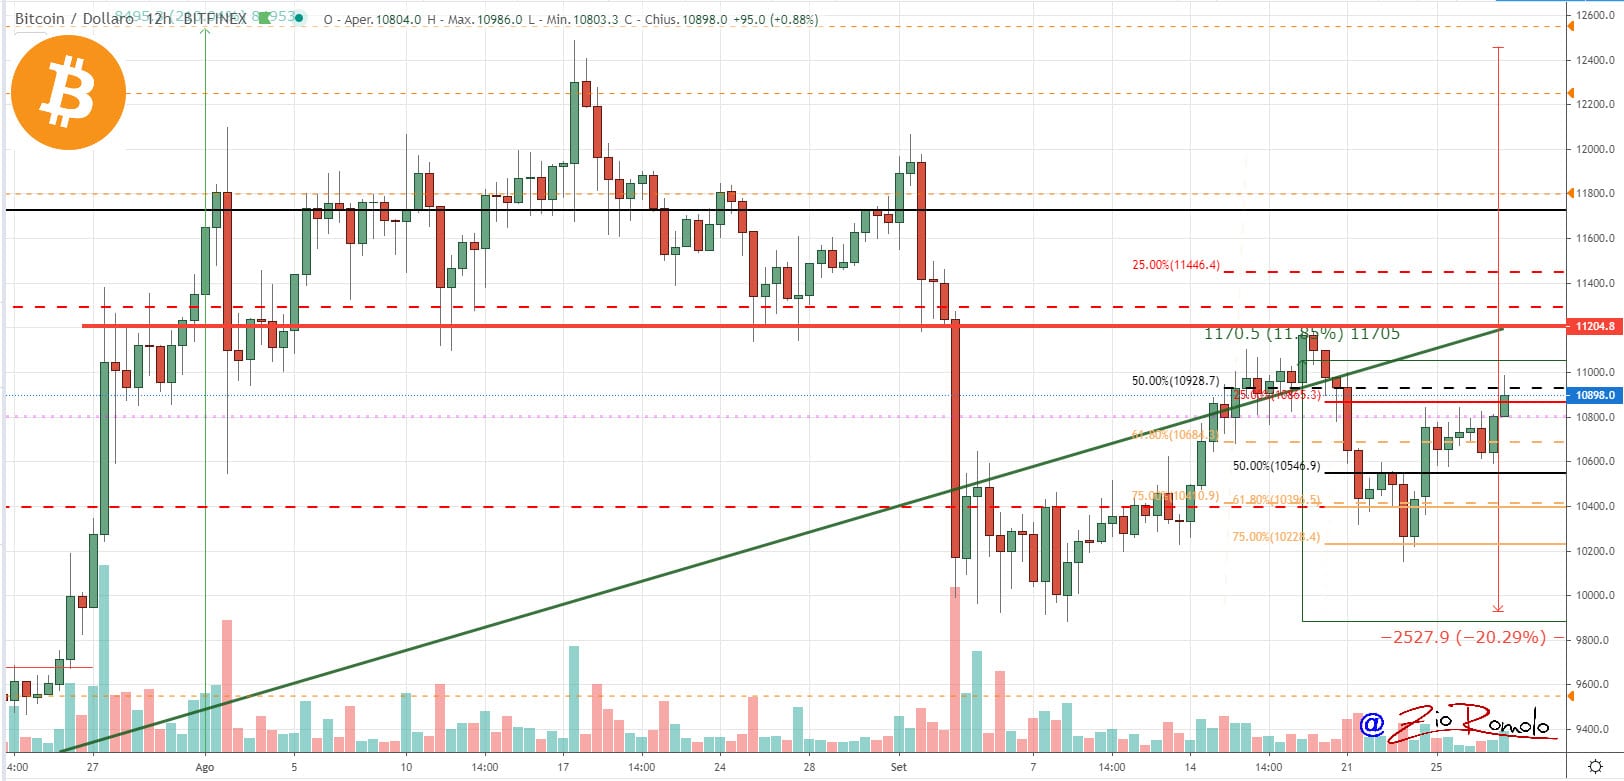
Bitcoin (BTC)
The rise of the last few hours brings Bitcoin prices back to a step of the psychological threshold of 11,000 USD, the highest level since last Monday, September 21st.
The important expiry of the monthly options last Friday did not cause the effects mistakenly predicted by many commentators. Option coverage is now shifting to other levels.
Prices are increasingly close to the $11,100 threshold test, the first level of resistance used by traders in options to protect against a return of bullish strength.
An extension above these levels could increase the volatility generated by hedges and consequently trade volumes. Downwardly, hedging is reduced and some of the protection is shifted to the $9,700 USD area.
Ethereum (ETH)
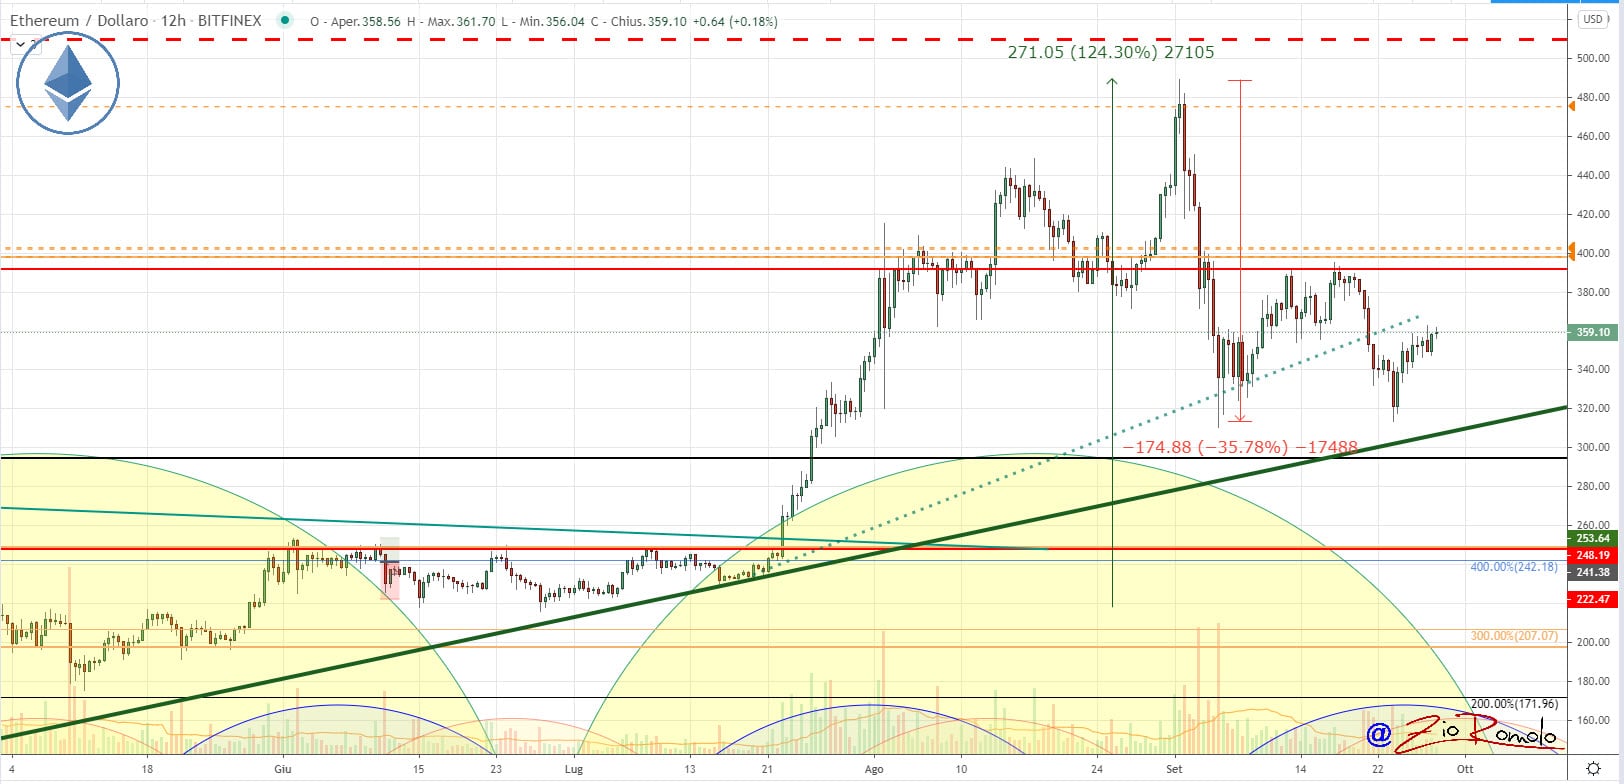
Since the beginning of the month, the 355 USD threshold has continued to prove to be an area of conflict between bulls and bears. All the attempts to stretch developed during the month, both upwards and downwards, have reabsorbed the movements with prices swinging again in this area.
This is also demonstrated by the strategies in options that keep hedging upwards between the 390 and 415 USD area and downwards between 345 and 325 USD. These areas draw the lateral channel, a level that from the first week of September forces prices to move.
The next directional movement will explode when prices leave this trading range.


