We are starting to run out of words to comment and describe the trend of Bitcoin which, since mid-December, has started a race that seems to know no more stops and that marks new records for price and market capitalization.
Twenty-two days have passed since December 16th when the price of Bitcoin broke the wall of 20,000 dollars, disintegrating the previous historical record. In this period, as many as 14 days, i.e. more than half, have recorded new absolute records by scoring an increase from 18,000 to over 37,000 USD, doubling the price of a Bitcoin in less than a month.
A trend greater than the previous dazzling rally between November and December 2017. A parallelism that day after day exalted the current rise relegating to memories what happened exactly three years ago.
The drop at the beginning of the week – January 4th – which saw the price of Bitcoin lose just under 20% in less than 24 hours, causing a loss of over 6,300 USD, the worst daily descent in history, did not frighten investors who went back to buying again causing the price to rise.
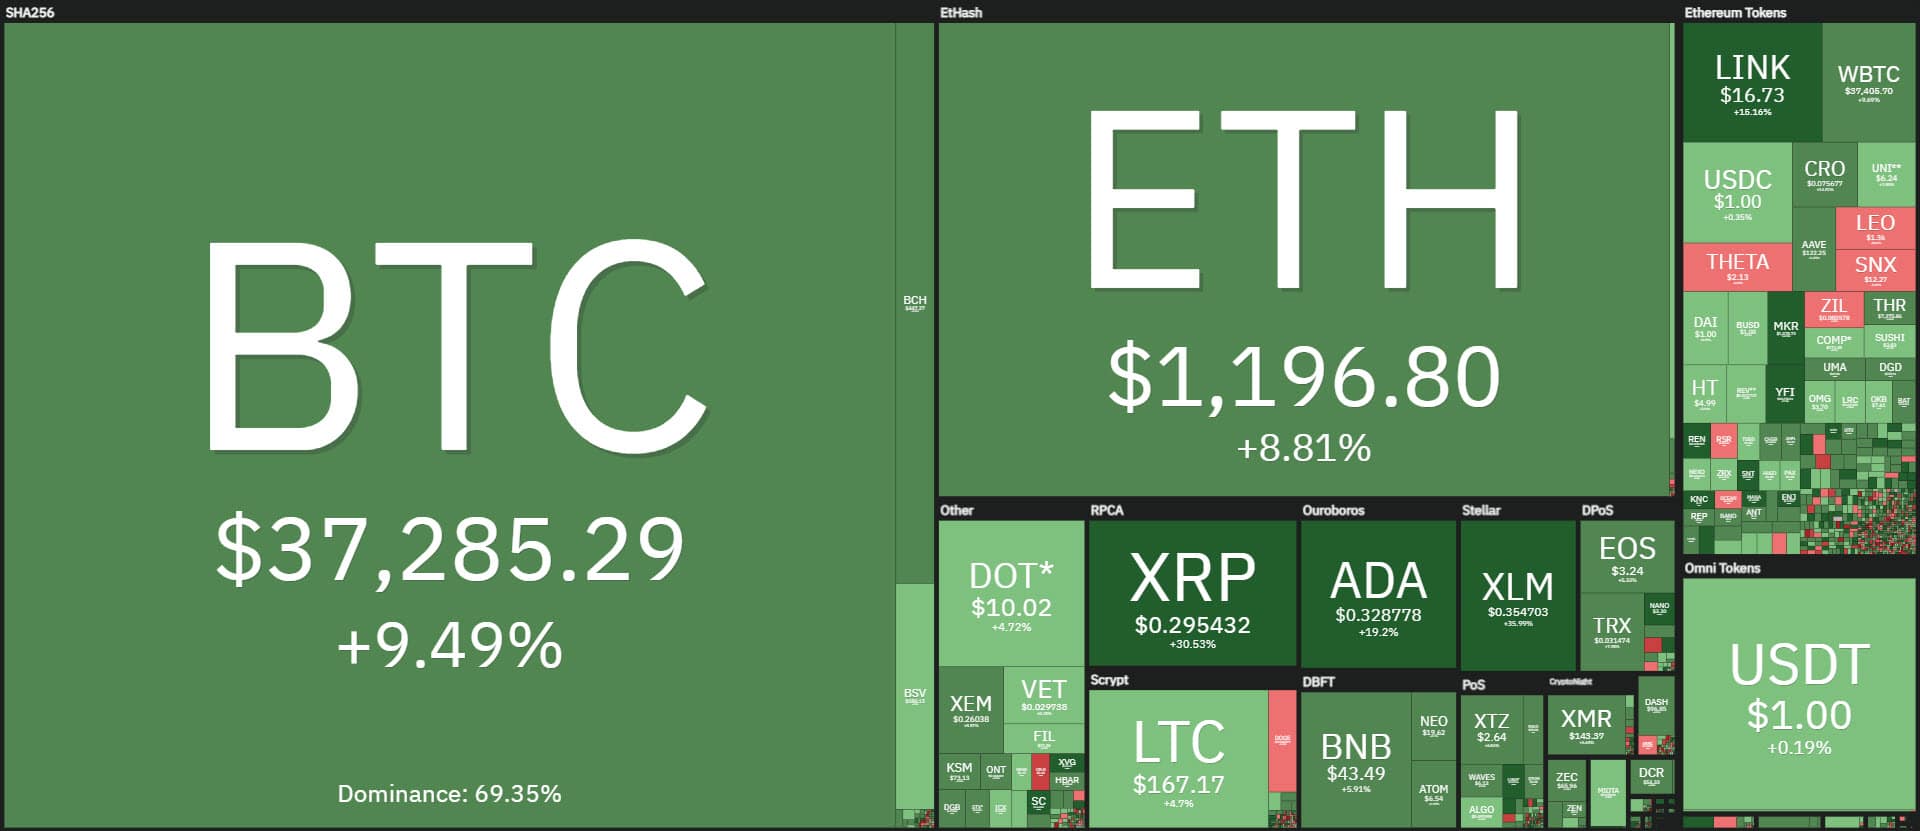
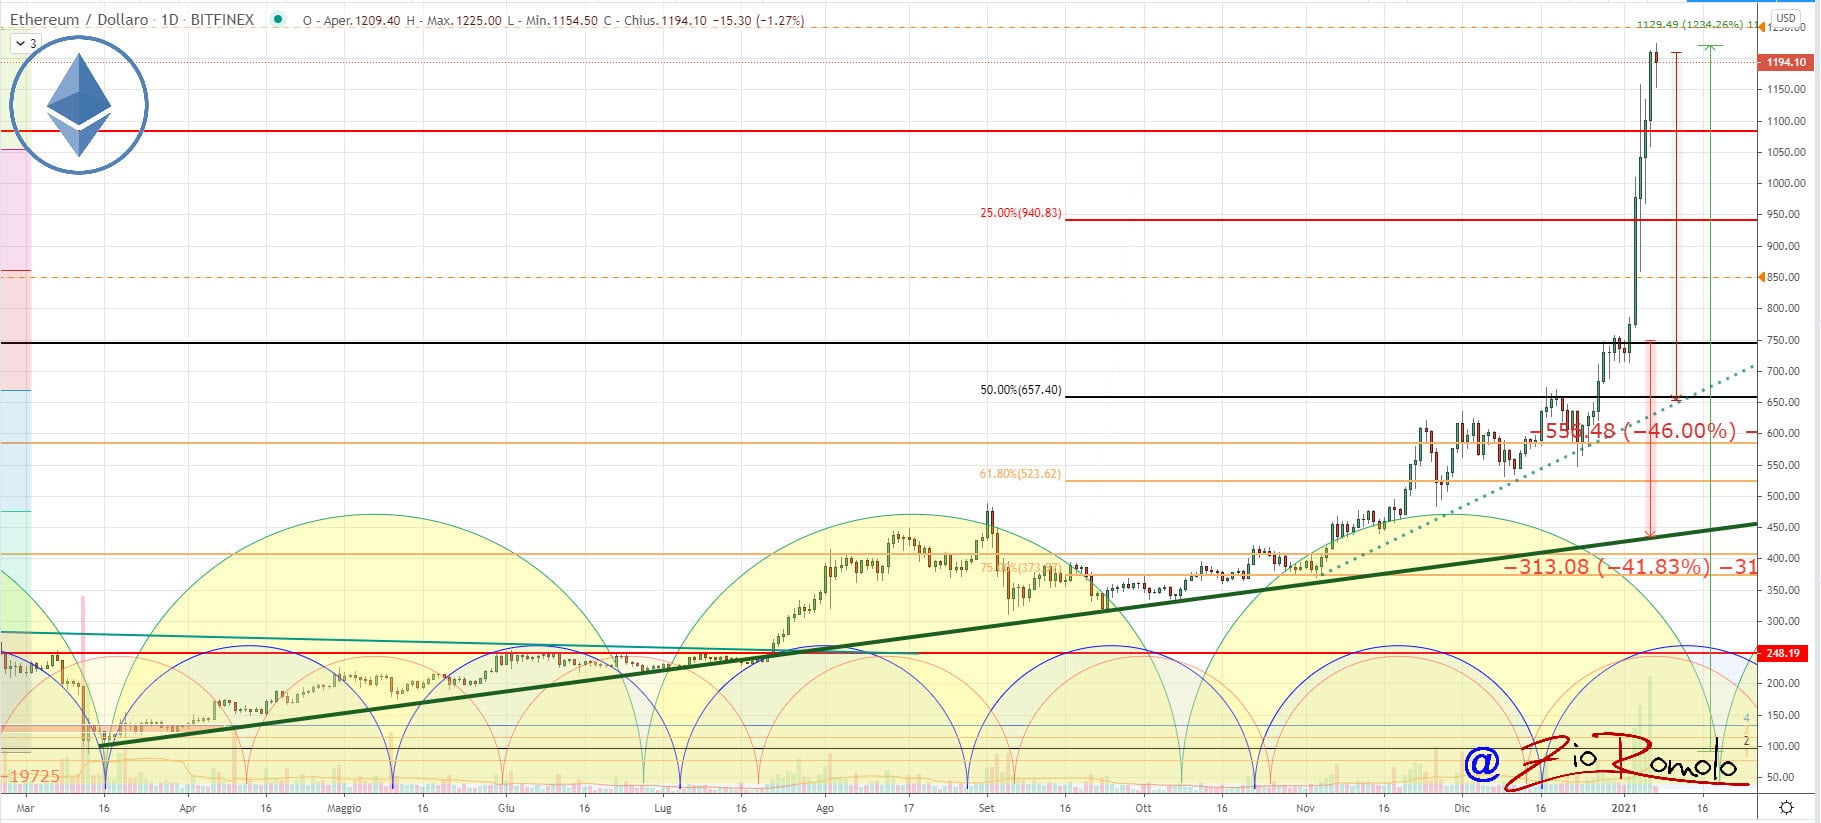
A few minutes after the start of the day (calculated using the CET time zone of London+1) the price of Bitcoin marked a new all-time record of 37,720 USD, dragging along also Ethereum, which updates the highest record of the last three years at 1,225 USD, as well as most of the Altcoins.
It’s a choral rise that shuffles the top ten capitalized charts. The head-to-head battle for third position between Ripple (XRP) and Litecoin (LTC) continues with XRP up over 30% in less than 24 hours, taking the podium of the day’s best, led by Stellar (XLM).
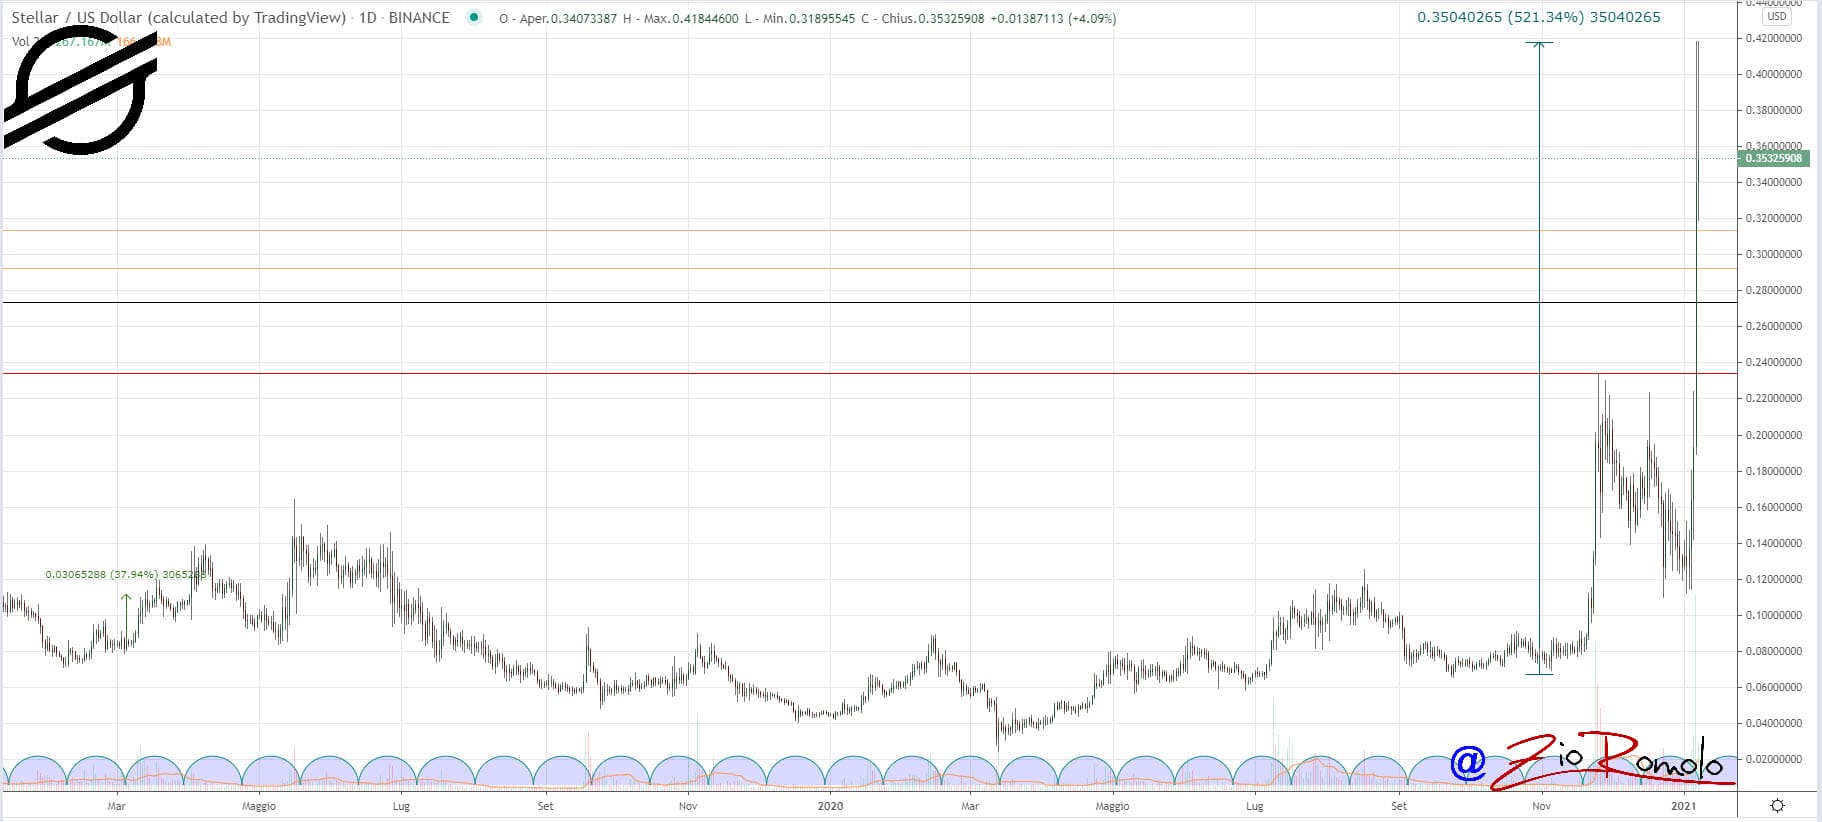
With a flight of over 60% and price one step away from 42 cents, the highest level since May 2018, Stellar rises to 10th position undermining Binance Coin (BNB).
Among the best, Cardano (ADA) shines, recovering 35 cents on the dollar with a rise of more than 20% from yesterday morning’s levels, conquering for the first time the 5th position in the ranking, overtaking Bitcoin Cash (BCH). BCH’s ascent to 460 USD, which has gained just over 25% since the start of the year, is not enough.
Bitcoin: price takes market capitalization to an all-time high
The rise of the last few hours raises for the first time the total market capitalization above $1 trillion. In one year – since January 1st, 2020 – the market cap of the entire sector has multiplied five times.
The credit goes to Bitcoin, which occupies about 69% of the market share and a capitalization that in these hours reaches $700 billion, doubling the previous peak in December 2017.
The recent climb in the price of Ethereum pushes the capitalization to $135 billion, above the previous record reached in January 2018. Despite this, Ethereum’s market share loses a few decimals from its highest peak in two years of 14% recorded yesterday. XRP tries to rise again from last week’s quicksand, returning above 1.3% .
DeFi: TVL at $21 billion
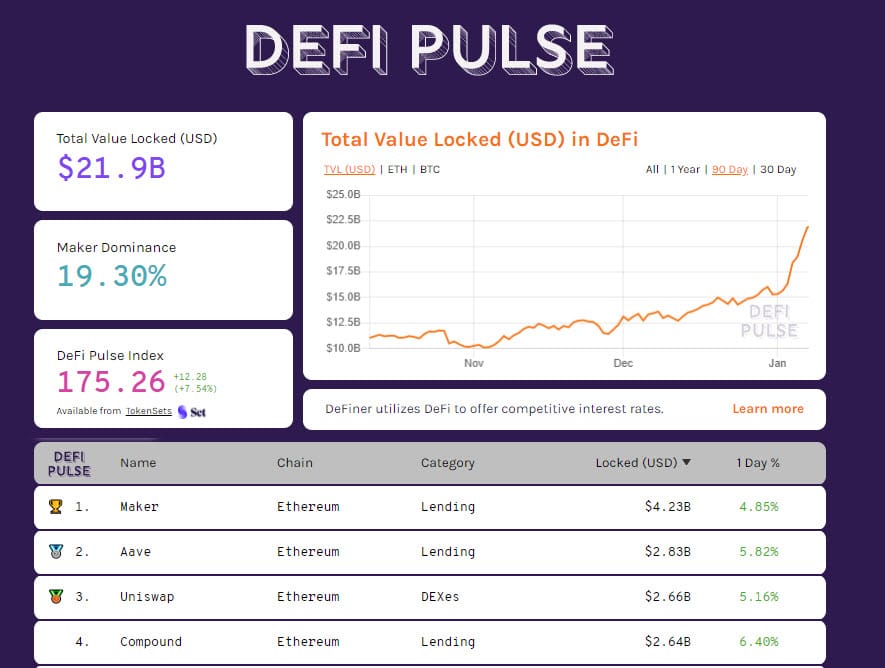
Despite the number of tokens used as collateral continuing to be withdrawn from decentralized platforms, the increase in token value propels the Total Value Locked (TVL) over $21 billion, a new record.
The leader Maker climbs above $4 billion for the first time in its history, sending MKR governance token quotes soaring above $1,200 USD, the highest level since the listing occurred in May 2018. Aave retains the second position followed by Uniswap which continues the head-to-head with Compound.
Bitcoin (BTC)
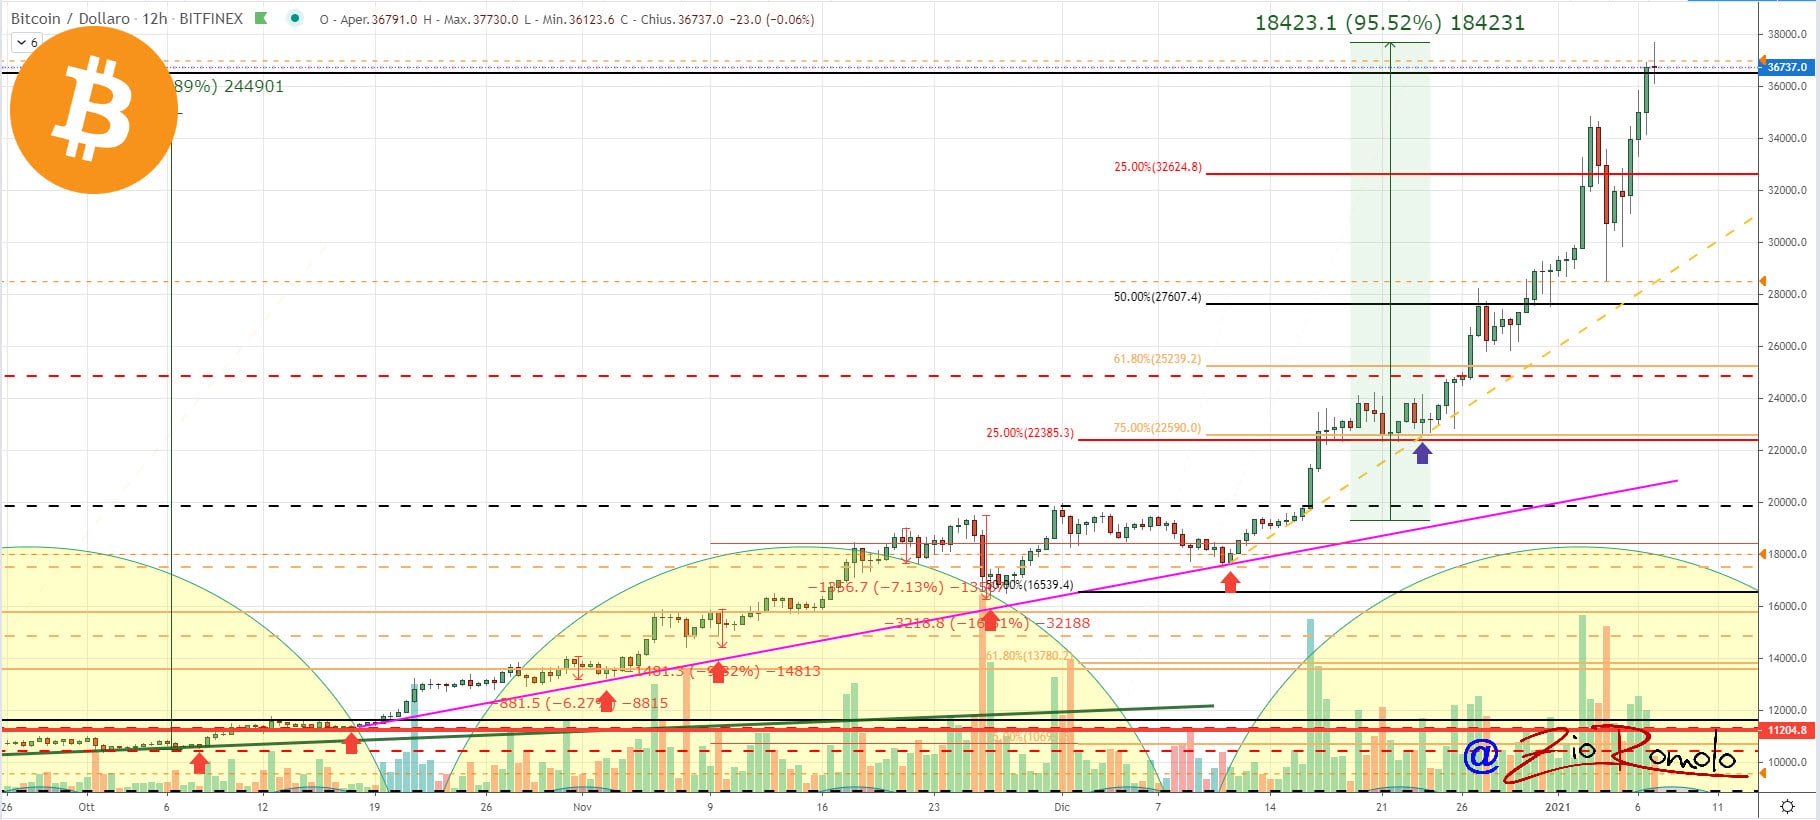
Third day on the rise for Bitcoin which registers a new all-time high just a step away from $38,000. It’s a rise that since Monday, Jan. 4th, sees Bitcoin prices gain about 24% in 4 days.
The rise at the beginning of the day also coincided with some profit-taking that currently brings Bitcoin prices back below $36,500, without worrying the strong uptrend that has been characterizing Bitcoin’s performance since mid-December.
Volumes exploded and yesterday they recorded the highest peak for exchanges on the main exchanges with over 13.3 billion dollars, an all-time record for exchanges in counter value in dollars. This marks the particular moment of Bitcoin that sees a smaller amount of Bitcoin change hands, for a countervalue that marks absolute historical records. In these first 6 days of 2021, January 1st alone saw trades below $10 billion.
On a technical level, Bitcoin prices are moving away from the first short-term support area that from $30,000 now moves to $32,600, the area of 25% of the Fibonacci retracement calculated from the mid-December minimum to the highs recorded a few hours ago.
Only a drop below this threshold would give a warning signal in the short term while in the medium term is far from the warning level that in these hours passes just below $29,000, an area more than 20% away from current levels.
Ethereum (ETH) price
The strong rise sees the price of Ethereum mark a vertical climb from the lows of January 2nd, with the value gaining over 70% in five days bringing capitalization back above $1,200 for the first time since late January 2018.
For Ethereum, the consolidation of the trend built in recent months is finding the explosion in these days with support levels in a medium to long term perspective increasingly distant. At the same time, this strong movement of these last 5 days, +75%, gives ETH ample room for movement in a short-term perspective, as happened in recent weeks for Bitcoin.
These strong movements should increase attention and caution for shocks that in an intraday perspective could develop even into double digits with greater evidence than what happened last Monday with a movement that saw prices fluctuate by more than 25% in just over two hours.
The current bullish structure definitely removes the risk of endangering the medium-long term trend. The first warning signal would arrive with prices just over 700 dollars, a level about 50% away from the current quotations.


