Summary
Bitcoin Price Analysis
On Wednesday, Bitcoin’s price sold off for a third straight day and finished Wednesday’s daily candle -$1,089.
The BTC/USD 4HR chart below from Akamer-the-Werewolf shows BTC bulls attempting to cling to the 0.382 fib level [$47,979.54] as support.
Bullish BTC traders are also trying to pivot at the 0.382 fib and rally back above the 0.5 fib level [$49,817.9] before regaining $50k.
Conversely, bearish BTC traders are hoping to crack the 0.382 fib level and then send BTC’s price back down to the 0.236 fib level [$45,669.04].

Another chart to consider is the BTC/USD 1M chart from Midwest, which compares prior cycles and the most recent cycle for bitcoin. The number of bars/days per cycle is pretty astonishing, and many experienced traders are digesting similar data to determine where BTC’s price will go next.

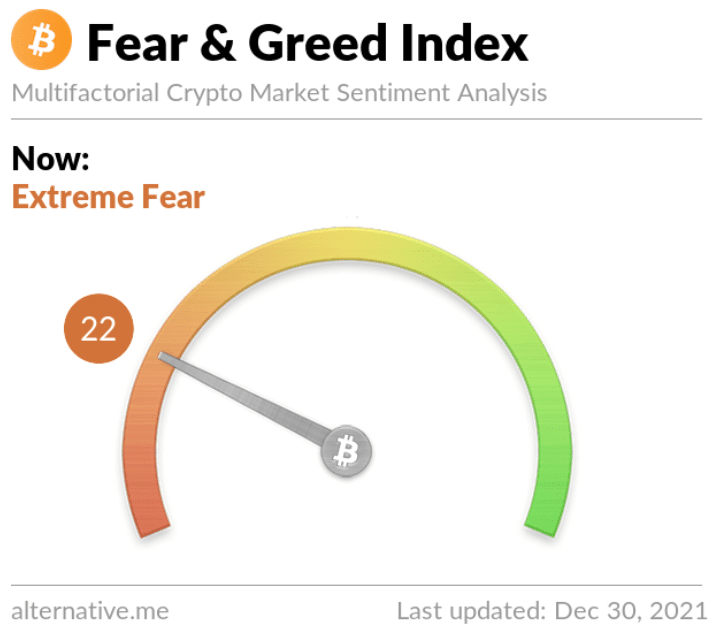
The Fear & Greed Index is 22 Extreme Fear and -5 from yesterday’s reading of 27 Fear.

BTC’s Moving Averages: 20-Day [$49,524.61], 50-Day [$56.286.52], 100-Day [$52,709.58], 200-Day [$48,325.68], Year to Date [$47,409.92].
BTC’s 24-hour price range is $46,224-$48,198 and its 7-day price range is $46,224-$51,956. Bitcoin’s 52-week price range is $27,316-$69,044.
The price of bitcoin on this date last year was $28,837.
The average price of BTC for the last 30 days is $50,055.
On Wednesday, Bitcoin [-2.29%] closed its daily candle worth $46,465.
Ethereum Analysis
Market sellers sent Ether’s price down with the bulk of the cryptocurrency market on Wednesday, and ETH finished the day -$166.

The ETH/USD 1D chart above from Balte shows the important levels for Ether traders. Ether bulls failed to hold the 0.382 fib level [$3,668.89]. With Ether’s price below 0.382, bulls’ next major level is the 0.618 fib level [$2,924.31].
If Ether bulls want to regain momentum, they first need to reclaim the $4k level, which has been an important inflection over the past few months.
Ether’s Moving Averages: 20-Day [$4,069.30], 50-Day [$4,255.32], 100-Day [$3,810.57], 200-Day [$3,144.89], Year to Date [$2,774.45].
ETH’s 24-hour price range is $3,632-$3,837, and its 7-day price range is $3,632-$4,157. Ether’s 52-week price range is $722.24-$4,878.
The price of ETH on this date in 2020 was $752.86.
The average price of ETH for the last 30 days is $4,104.
Ether [-4.38%] closed its daily candle on Wednesday, worth $3,627.17.
Gala Analysis
Gala’s price finished Wednesday’s daily candle $-.017 and in red digits for the second straight day.
The GALA/USD 4HR chart below from LA_Designer illuminates the importance of reclaiming the 0.618 fib level [$0.46] for Gala bulls in the short term. If bulls fail at the 0.618 fib level, Gala bears will be seeking a return to the 0.786 fib level [$.439].
If bullish Gala traders are able to rally above the 0.618 fib their target overhead is the 0.5 fib [$0.48] with a secondary target of 0.382 [$0.49].

Gala’s price is +160,000% against The U.S. Dollar over the last 12 months, +88,200% against BTC, and +30,100% against ETH over the same duration.
Gala’s 24-hour price range is $.443-$.488, and its 7-day price range is $.443-$.545. Gala’s 52-week price range is $.0745-$.824.
Gala’s price on this date last year was $.00163.
The average price for Gala over the last 30 days is $.502.
Gala [-3.51%] closed Wednesday’s daily candle valued at $.449.


