Summary
Bitcoin rally
Bitcoin’s price reversed slightly to the upside during Tuesday’s daily session and concluded the day +$718.
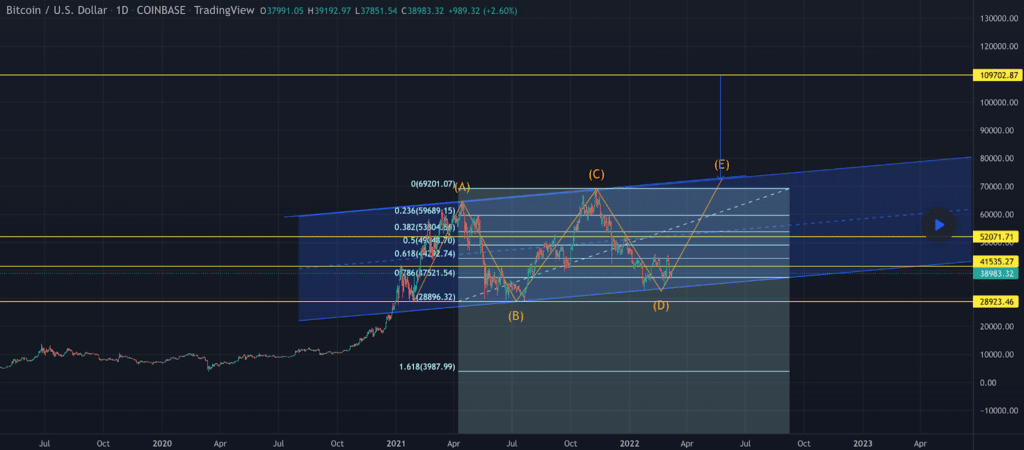
The first chart we’re analyzing today is the BTC/USD 1D chart below from Cryptobegginer. BTC’s price is trading between 0.786 [$37,521.54] and 0.618 [$44,202.74], at the time of writing.
Traders that are anticipating upside next for BTC are seeking a first target of the 0.618 fib level with a secondary target of 0.5 [$49,048.70] and a third target of 0.382 [$53,804.55].
Bearish market participants are conversely taking aim at snapping the 0.786 to the downside with a secondary target of 1 [$28,896.32].


Bitcoin’s Moving Averages: 20-Day [$40,966.69], 50-Day [$41,264.16], 100-Day [$48,955.46], 200-Day [$45,642.06], Year to Date [$40,901.76].
BTC’s 24 hour price range is $38,136-$39,334 and its 7 day price range is $37,387-$44,790. Bitcoin’s 52 week price range is $29,341-$69,044.
The price of bitcoin on this date last year was $54,700.
The average price of BTC for the last 30 days is $40,655.
Bitcoin’s price [+1.89%] closed its daily candle worth $38,757 and snapped a streak of two red daily candle closes prior.
Ethereum Analysis
When traders settled up on Ether on Tuesday ETH’s price was in green figures and concluded its daily candle +$84.68.
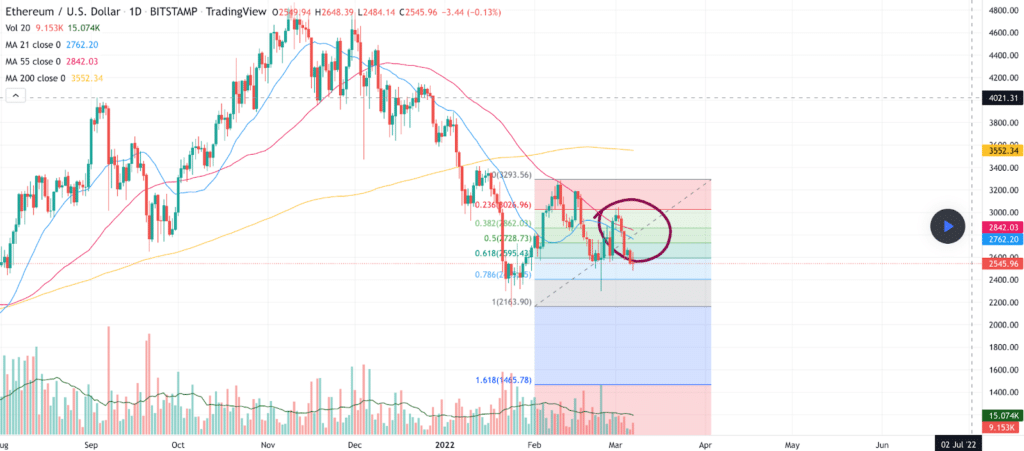
The second chart we’re analyzing today is the ETH/USD 1D chart from IceCreamMayDay. Ether’s price is trading between the 0.786 fib level [$2,411.65] and 0.618 [$2,595.43].
Bullish Ether traders are hoping to hold the $2,5k level and rally back above the 0.618, 0.5 [$2,728,73], and 0.382 [$2,862.03].
If the objective to reverse course to the upside fails by bullish ETH traders, we’ll soon see the 0.786 fib level tested with a secondary target 1 [$2,163.90] and a third target of 1.618 [$1,465.78].

ETH’s 24 hour price range is $2,507-$2,620 and its 7 day price range is $2,467-$3,014. Ether’s 52 week price range is $1,558-$4,878.
The price of ETH on this date in 2021 was $1,869.
The average price of ETH for the last 30 days is $2,795.
Ether’s price [+3.40%] closed its daily candle on Tuesday valued at $2,577.21.
Avalanche Analysis
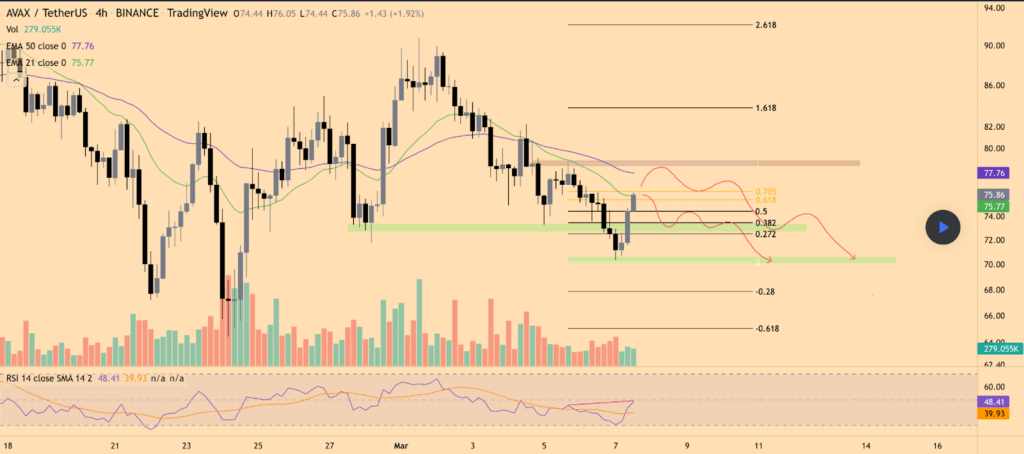
The third project we’re analyzing today is Avalanche and the AVAX/USDT 4HR chart below from Coinathlon. AVAX’s price is trading between the 0.382 fib level [$73.47] and 0.5 [$74.41], at the time of writing. Traders that are bullish on Avalanche are looking to break 0.5 to the upside with a secondary target of 0.618 [$75.37] and a third target of .705 [$76.16].
Bearish AVAX market participants are seeking to break 0.382 and looking to push AVAX’s price below 0.272 [$72.47] and a full retracement at 0 [$70.25] eventually.

Avalanche’s 24 hour price range is $71.57-$76.09 and its 7 day price range is $70.88-$89.06. AVAX’s 52 week price range is $9.33-$144.96.
Avalanche’s price on this date last year was $34.28.
The average price of AVAX over the last 30 days is $80.60.
Avalanche’s price [+1.78%] closed its daily session on Tuesday worth $73.05 and in green figures for the first time in three days.


