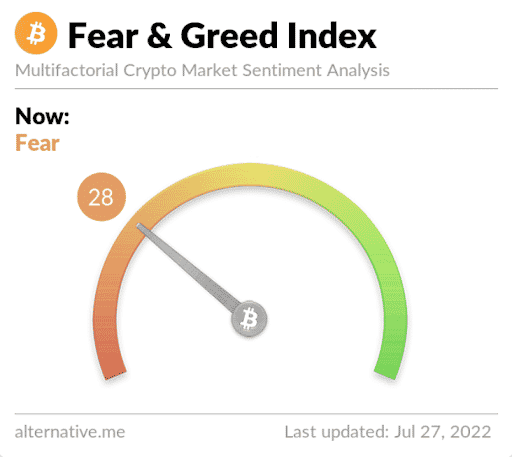
Summary
Bitcoin Analysis
Bitcoin’s price sold-off heavily during the first 12 hour candle on Tuesday but bullish traders rallied during the second half of the day and BTC’s price concluded its daily session -$31.6.
The first chart we’re analyzing for Wednesday is the BTC/USD 4HR chart below from howard2535. BTC’s price is trading between the 0.618 fibonacci level [$20,144.93] and 0.5 [$20,938.84], at the time of writing.
BTC’s price closed above the 200W MA on Tuesday and pivoted at that crucial level. The first fib target overhead is 0.5 followed by 0.382 [$21,732.74] and 0 [$24,302.84].
Bearish BTC traders are looking to push BTC’s price below the 0.618 fib level and $20k again. That will set up bears for a retest of BTC’s 2017 all-time high of $19,891 before another potential retest at 0.786 [$19,014.62]. The third fib target to the downside is 1 [$17,574.62].


Bitcoin’s Moving Averages: 5-Day [$22,416.59], 20-Day [$21,021.97], 50-Day [$24,261.12], 100-Day [$32,041.61], 200-Day [$40,497.6], Year to Date [$34,873.17].
BTC’s 24 hour price range is $20,724-$21,614 and its 7 day price range is $20,724-$24,160. Bitcoin’s 52 week price range is $17,611-$69,044.
The price of Bitcoin on this date last year was $39,563.
The average price of BTC for the last 30 days is $21,019.3 and its -2.5% for the same duration.
Bitcoin’s price [-0.15%] closed its daily candle worth $21,271 on Tuesday and narrowly in red figures for a second straight day.
Ethereum Analysis
Ether’s price rallied extremely hard during the day’s final 4HR candle and closed its daily session +$12.29.
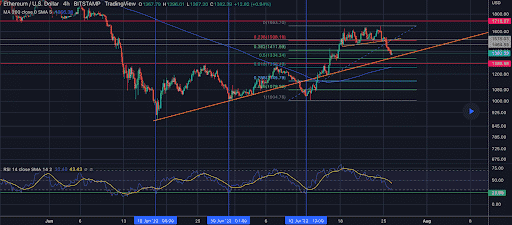
The Ether chart for analysis today is the ETH/USD 4HR chart below from a_fisshh. Ether’s price is trading between 0.5 [$1,334.24] and 0.382 [$1,411.99], at the time of writing.
The overhead targets on ETH are 0.382, 0.236 [$1,508.19], and 0 [$1,663.7].
Conversely, bears are hoping to again send ETH below the $1k level. Before bearish traders can accomplish that feat, they’ll firstly need to break the 0.5 fib level. The second target to the downside is 0.618 [$1,256.49] and the third target is 0.786 [$1,145.79].

ETH’s 24 hour price range is $1,356.17-$1,455 and its 7 day price range is $1,356.17-$1,639. Ether’s 52 week price range is $883.62-$4,878.
The price of ETH on this date in 2021 was $2,301.45.
The average price of ETH for the last 30 days is $1,268.32 and its +12.13% over the same time frame.
Ether’s price [+0.85%] closed its daily candle on Tuesday worth $1,450.91 and in green figures for the third time over the last four days.
Binance Coin Analysis
Binance Coin’s price was sent higher on Tuesday by bullish traders and wrapped-up its daily trading session +$4.6.
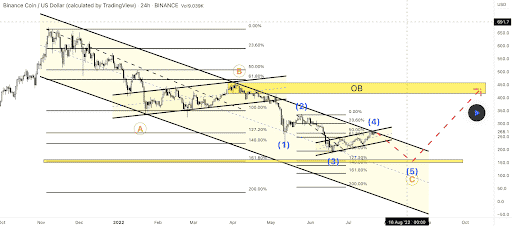
The third chart we’re providing analysis for today is the BNB/USD 1D chart below from GANGSTAR_PARADISE. BNB’s price is trading between 100.00% [$194.5] and 61.80% [$248.2], at the time of writing.
The first target to the upside for Binance Coin bulls is 61.80% with a secondary target of 50.00% [$265.7]. The third target to the upside on BNB is 23.60% [$302.].
The first target to the downside on BNB is the 100% fib level followed by 127.20% [156.8] and a third target of 161.80% [$109.8].

BNB’s 24 hour price range is $239.6-$249.8 and its 7 day price range is $239.6-$270.93. Binance Coin’s 52 week price range is $184.1-$668.8.
Binance Coin’s price on this date last year was $313.7.
The average price of BNB over the last 30 days is $239.6 and its +1.17% over the same timespan.
Binance Coin’s price [+1.88%] closed its daily session worth $249.3 on Tuesday and in green figures for the second time over the last three days.


