Bitcoin continues its drop in price: the fall brings the quotations below 10,000 dollars, testing the lows at the beginning of the month. This confirms that last week’s upward movement can be defined as the classic technical rebound ahead of finding support levels.
It is, therefore, necessary to wait for the developments in the coming days. It is important for bitcoin to keep the supports built during the recent rise with the first bullish movement at the beginning of April. At the moment the prices at the end of June are the highest levels from which BTC is now 25% distant.
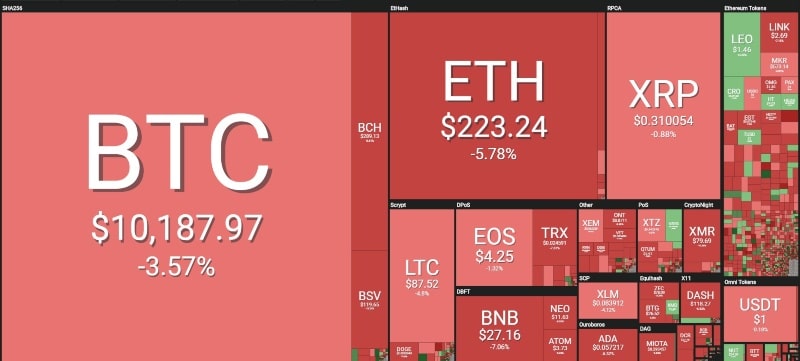
Not only for bitcoin, but the day is also negative for the whole sector, with red signs prevailing for more than 90% of cryptocurrencies. This reflects the weekend’s events, which saw the whole sector drop.
Moreover, these movements show higher trading volumes over the last two weeks, causing the sector to move, accompanied by the fall in volumes. There are no particular tensions with massive sales.
All other altcoins, such as Ethereum and Ripple, perform worse than bitcoin, with a 45% loss from the June highs.
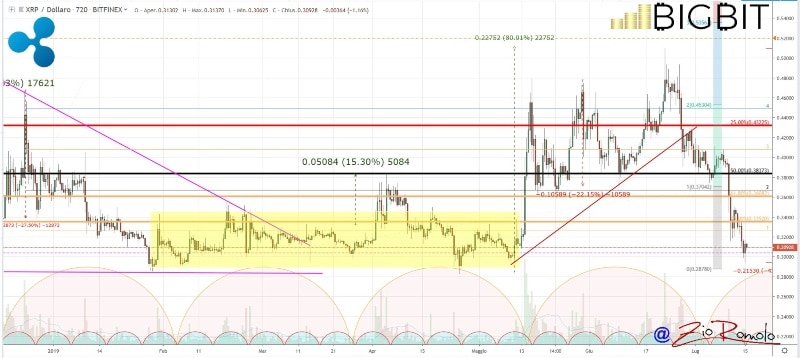
Among the big ones there is Ripple who accuses one of the heaviest declines with prices that return to test the levels that already in January, February and late April had pushed the bearish attacks. For Ripple, prices are in a medium-term support and a possible violation could compromise the structure of the annual cycle.
Today there are few green signs. Japan Content Token (JCT) emerges in contrast to the trend that, with 61 million dollars, manages to climb and get to 90th position with an excellent rise of +45% today.
Even LEO today attempts to get out of the murky waters of last week by scoring a rise of 4% with a value of 1.5 dollars.
As far as capitalisation is concerned, it loses about 100 billion dollars from the highs recorded at the end of June and dives under the psychological threshold of 300 billion: now it is at 278 billion.
The dominance of bitcoin is 66%, with higher levels since April 2017. In this delicate phase of weakness, bitcoin appears to be a safe haven, while the sinking of Ethereum, which loses 28% of its value in a week, brings its market share to 8.6%, the lowest level reached since last December. This benefits the dominance of Ripple at 4.6% after having hit the bottom last week close to 4%.
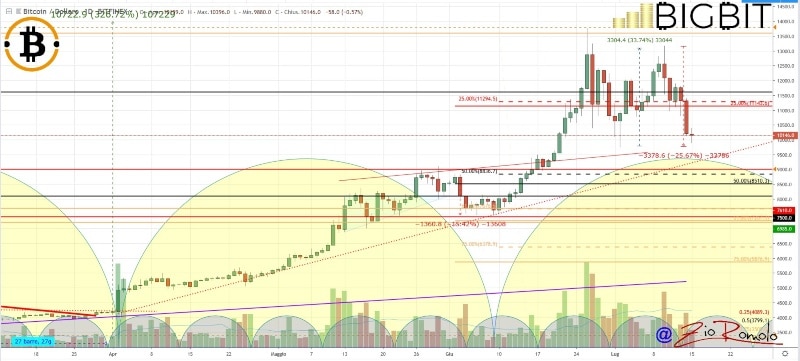
The drop in price for Bitcoin (BTC)
The price drop leads bitcoin today to test a very important level of support.
A downward rupture of the $9,800 lows, could confirm the development of the double high drawn with the values of June 26th and July 10th. A further lunge would project the price of bitcoin to test the support of $9,200 and the next even more delicate level in a medium-term perspective of $8,400.
At this stage, the price that could bring some peace of mind to BTC remains at a distance, at $11,200, 15% away from today’s values. In the next few days, it would be necessary to score a quick rebound of the price to bring back the calm.
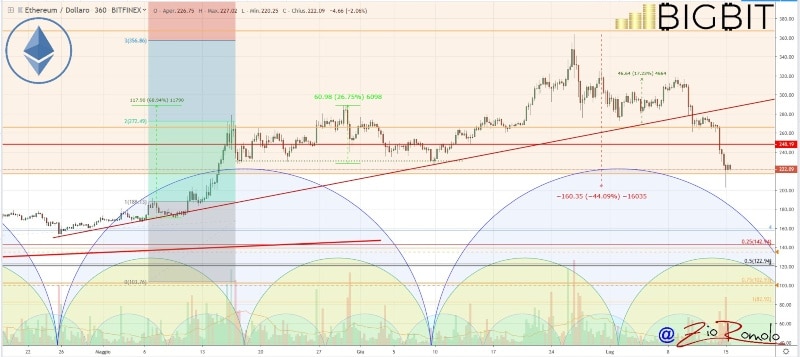
Price Ethereum (ETH)
For Ethereum, the dangerous sinking that took place during the night brings prices back close to $200, a level abandoned last May 15th: it is the lowest level in the last two months.
With this bearish movement, Ethereum goes to test the first support threshold in a bi-monthly perspective in line with the closure of the current two-month cycle started with the relative lows of June 10th.
It is a very delicate phase and further sinkings are not excluded for Ethereum. It is necessary to identify support levels where the beginning of the new bi-monthly cycle should be marked. A phase that surely remains more enjoyable for the Bears than for the Bulls.
In this situation, it is preferable to carefully monitor the technical and psychological threshold of $200. The first positive signal is the return over area 250-260 dollars, $40-50 away from today’s levels. For Ethereum it is necessary to maintain the quota of 200 dollars, and then the former resistance that has been the cap for every bullish attack in April and May.


