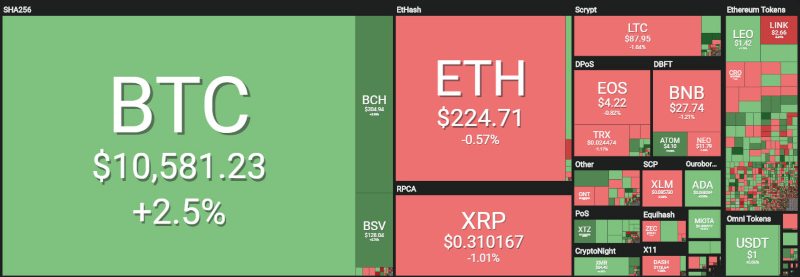
After a few worrying days, today the price of bitcoin is up again and the day is characterised by a prevalence of green signs, with 85% of cryptocurrencies above the parity threshold.

Double-digit rises are also back in sight after having reached the bottom yesterday.
In particular, bitcoin’s rise is noticeable and it returns to aim above 10,700 dollars. Whereas Ethereum scores a +15% double-digit rise from yesterday’s lows.

Ripple is also up +10%, thanks to the coverage after XRP went close to 29 cents, the lowest of the last seven months.

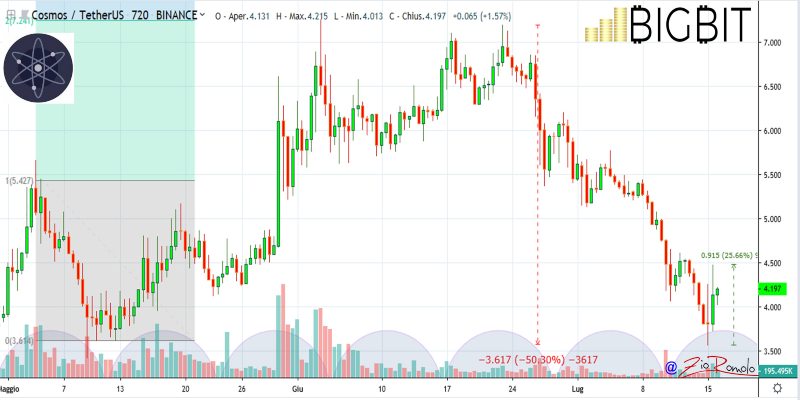
One of the biggest rises of the day is Cosmos (ATOM), which, after the bottom touched yesterday night, recovers 25%. Cosmos yesterday tested the lows of the last 4 months and now it rises by 15%.
Among the best of the day emerges ICON (ICX) which rises 21% from yesterday morning’s lows.
0x (ZRX) also reacts very well, as it seems to have overcome the network problems that have arisen in recent hours. 0x with yesterday’s drop saw prices go close to 20 cents, lowest levels since the beginning of 2019 and absolute historical lows.
Despite the prevalence of positive signs, it is worth noting that Crypto.com Chain (CRO) has fallen by 5%. Chainlink (LINK), after the strong increases of the past weeks, also tries to consolidate itself between 2.5-3 dollars and today it decreases by about 2%.
Capitalisation is back on the rise, approaching $290 billion, with not particularly high volumes. In the last 24 hours, there have been trades of less than 80 billion dollars.
In this phase, bitcoin’s strength and behaviour continue to be noticed. Bitcoin today is looking upwards and is approaching the dominance of 67%, levels abandoned in March 2017. This shows that in this particular weakness phase of the altcoins, which fail to maintain stability, the price of bitcoin displays confidence.
Ethereum’s dominance slips below 8.5%, while Ripple tries to show a slight hold, climbing a few decimals and reaching just over 4.5%.

The price of bitcoin (BTC) is up today
Bitcoin, after having suffered a 25% drop from the July 10th highs, climbs today by about 12% from yesterday morning lows by testing the 11,000 dollars overnight.
At the moment, the price of BTC shows that it is holding up its July lows, trying to establish and form a solid basis from which to trigger a rise. It is still too early to assess this rebound.
It is necessary to wait for the consolidation in the $9,800-10,000 area. A downward violation could trigger bearish speculation with targets in the $9,200-8,800 area.
In order to definitively clear these stormy clouds, in line with the bi-monthly cycle approach that began with the lows of the second week of June, it is necessary for BTC to recover $12,000, levels that are $1,000-1,500 away from the current levels.

The price of Ethereum (ETH)
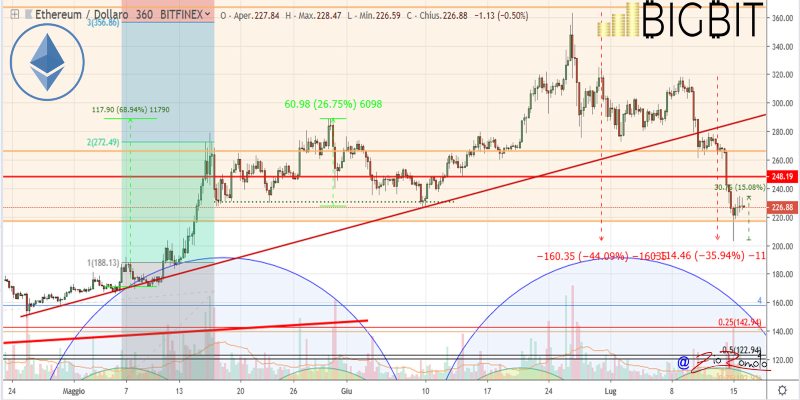
The sinking recorded in the last 48 hours brought Ethereum’s prices back to test a former level of resistance that in mid-May had triggered a strong bullish race pushing prices up to the year’s high reached on June 26th in the $363 area.
The decline of the last 2 days causes a loss of about 45% to the price of Ethereum, testing the psychological threshold of 200 dollars.
For Ethereum it is necessary in the next hours to confirm this rebound and the holding of the 230 dollars, levels at which prices are oscillating now, in order to be able to attack the 275-280 dollars. This is the area that would give the first bullish indications. On the contrary, a lunge below $200 would project prices to the test of $170-155.
At the moment, for Ethereum, the bullish trend has ended on a bimonthly basis and remains in line with the end of the bi-monthly cycle, which began with the lows of June 9th and could end at the end of July.
It is a delicate moment for Ethereum, and it is necessary to wait for confirmations in the next few days.


