

The price of Ripple (XRP) is finally increasing today, marking a strong rise after having traversed the quicksand of 25 cents of a dollar. In recent hours XRP has scored a rise with an intensity that was not recorded since last May, recovering the 30 cents abandoned last July.
In 36 hours Ripple rises 37%, and today is in the top five of the day with an increase of 16%.
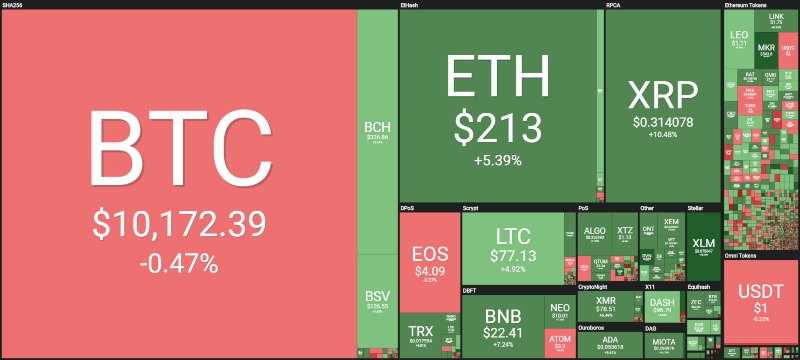
Yesterday’s signals saw Ethereum give the first bullish indications with the decisive exceeding of the threshold of 200 dollars.
Today, with a 6% rise, Ethereum goes beyond the $215, levels abandoned in early August.

IOTA is performing better with a 20% rise, but Stellar is the first in the class, rising by 40% with a recovery of the 0.09 cents for XLM, levels that had abandoned in July during a bearish trend that just 4 days ago saw XLM mark its absolute lows in the last 2 years going down to 0.057 dollars.
Stellar is the best of today’s top 100. Among the altcoins, it is the one that most resembles Ripple both in the price movements and in the project details.

Ripple benefits from unofficial rumours that have been extracted from statements recently made by the OECD Conference where one of the speakers pointed out that there is a relationship between the XRP token and the largest US exchange, namely Coinbase.
This brings to mind the rumours of last February when Coinbase Pro also added XRP to its basket by stirring up the misconceptions claiming that XRP’s entry into the Coinbase basket was due to a “courtesy payment”.
Moreover, during the OECD Conference, it was further confirmed that the MoneyGram circuit is trying to use the xRapid technology, one of the technologies supported by RippleLabs. The price of XRP benefited from this mix of news.
This context leads to euphoria in the altcoin sector, which is led mainly by Ethereum, which moves away from last week’s lows with an increase of over 30%.

On a daily basis, there are very few cryptocurrencies that are highlighted by movements below zero. MaidSafeCoin (MAID) is in 61st position, and today records a decidedly contained decrease of -6%. It is one of the few cryptocurrencies (10% of the first 100) in negative territory.
The dominance of bitcoin collapses, after the movements that continue to give no indication and the closure of two days with the lowest level of trading in the last 10 months.
This figure clearly summarises what is happening for bitcoin that fluctuates around 10,200 dollars without giving clear signals of strength.
Despite the overall day seeing an increase in daily trading volumes to 70 billion dollars, 20% higher compared to the last two days, bitcoin loses 2% of dominance falling in 24 hours close to 67%. This leads to a clear recovery by Ethereum and Ripple. Ethereum regains 8.5% of the entire market. Ripple’s dominance also rises above 5%, market share levels that XRP has not seen since last July.
The market cap rises above $273 billion. In addition, the cryptocurrencies listed by Coinmarketcap continue to take advantage of the particular period of September characterised by the continuous launch of new projects.

Price Bitcoin (BTC)
Bitcoin has been fluctuating between $10,200 and $10,400 for the past six days, further reducing daily volatility to below 2.6% on a monthly basis.
With a trend that continues within the bearish triangle, the psychological area of 10,000 dollars and the technical area of 9,500 dollars should always be taken into account. For bitcoin, it is necessary to go upwards beyond 11,000 dollars.

Price Ethereum (ETH)
Unlike what happened in the last month characterised by boring movements, Ethereum has regained the volatility that has gone beyond 30% from the lows of 10 days ago, regaining the 215 dollars.
For Ethereum, the probability of going over the threshold of 235 dollars, the relative maximums of the summer, becomes high thanks to the rediscovered support of the volumes.
This is an important signal because the entry of new purchases would consolidate prices above $200, a psychological threshold that would also give hope for the immediate future.
